
Germline editing debate
Do now
Argue a CER position on whether germline gene editing should ever be permitted in humans.
- Hand in
- One CER on whether germline gene editing should ever be permitted, plus a reflection naming one counterargument about consent of future generations.
- Where
- Turn this in at the drop folder with your district Microsoft sign-in, or hand it to Mr. Mendoza in class. Both count as submitted. Doing the activity in myPLTW does not.
You get two school days for every day you were absent, so this deadline moves with you.
In 2018, He Jiankui edited the CCR5 gene in twin embryos before birth. Those girls will pass that edit to their own children someday. Should any scientist ever be allowed to make a change that no future descendant consented to?
Argue a CER position on whether gene editing should ever be permitted in humans.
- • You'll be able to argue a position on with evidence.
- • You'll be able to address the consent problem in your reasoning.
- In your own words, what is the difference between changing a gene in one person and changing a gene that gets passed to every future generation?
- If a change to your DNA would also change your grandchildren's DNA, who should have to agree to it before it happens?
- 1Read the case brief in the course shell.
- 2Write two prepared questions contrasting and risks.
- 3Draft a CER with a claim, two pieces of evidence, and your reasoning about heritable edits.
- 4In the debate, note one counterargument about consent of future generations.
- 5Post your CER and reflection in the course shell.
What did this day actually feel like?
Germline editing debate
ETHICS MONDAY Editing a somatic cell affects one person. Editing the germline affects everyone descended from them, none of whom can consent.
That distinction does almost all the ethical work and I had not known it existed two hours earlier.
Turned in: CER → Claim Evidence Reasoning folder
Fiction. There is no such student. The lessons, labs and dates are the real planned course; the student, the classmates and the conversations are invented.
The same day, drawn.
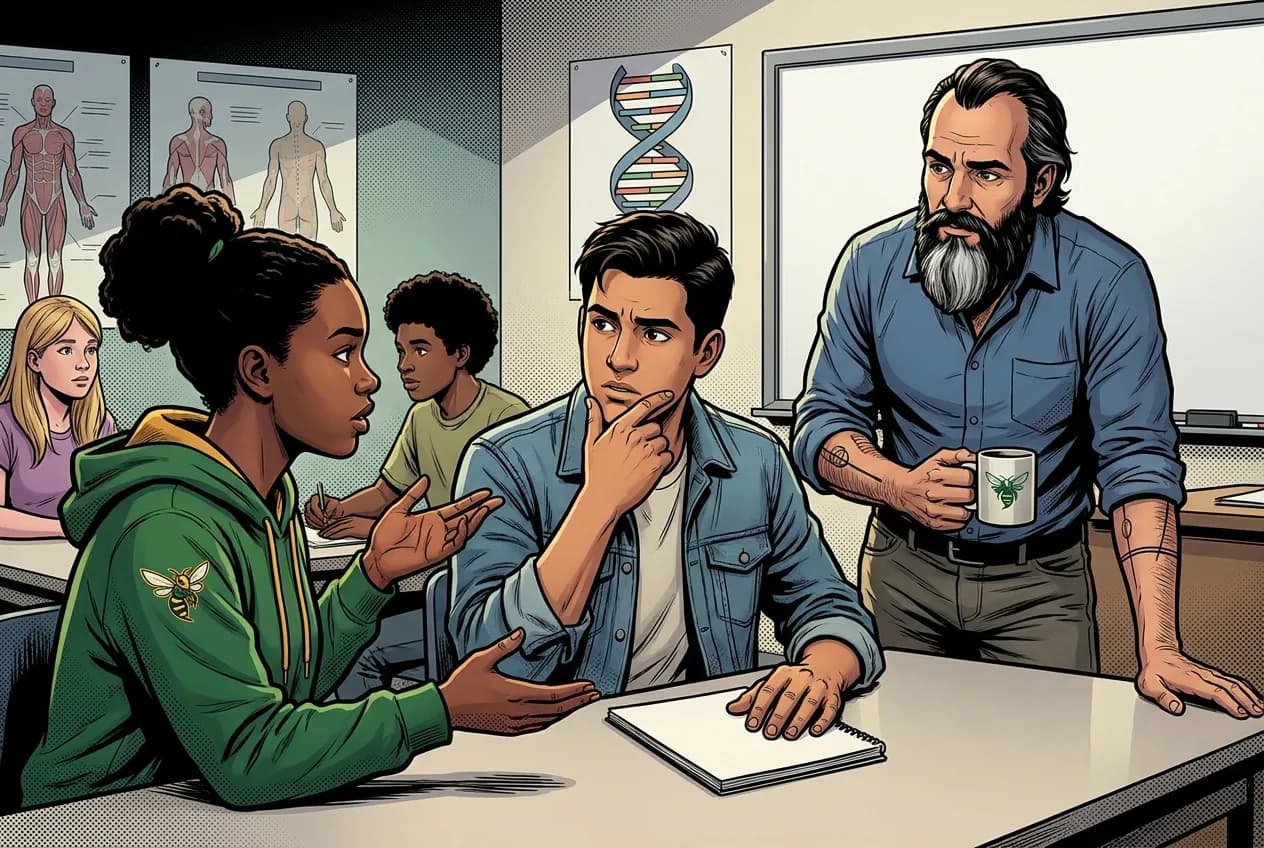
Editing a somatic cell affects one person. Editing the germline affects everyone descended from them, none of whom can consent.
Fiction. There is no such student. The lessons, labs and dates are the real planned course; the student, the classmates and the conversations are invented.
🛠 Get unstuck · pick your level
🔑 Today's words · 5
Tap a word in the lesson for a plain meaning and one example. Recycled into next week's Do-Now.
Do the work · 80-minute blockfirst 5 min = hook▸
💡 Big idea: A edit is copied into every descendant cell, so the people it changes most are the ones who were never able to consent.
- 0-5Hook: He Jiankui summary; frame debate question
- 5-20Silent read of case brief; draft two contrasting questions
- 20-35CER draft: claim on permissibility, two evidences, reasoning naming consent
- 35-65Structured debate: permit-under-strict-conditions vs. absolute prohibition
- 65-75Written reflection: state one counterargument about future-generation consent
- 75-80Post CER and reflection to course shell
- • Hook: Summarize the He Jiankui case in two sentences and ask: was the scientific community's reaction appropriate?
- • Why it matters: could eliminate heritable diseases or open the door to enhancement for those who can afford it.
- • Today's structure: case brief, CER prep, structured debate, reflection.
- • Exit goal: CER and reflection posted to the course shell before the bell.
- • edits affect egg, sperm, or cells and are inherited by all descendant cells and future generations.
- • edits only the patient's non-reproductive cells; the change is not heritable.
- • The 2018 He Jiankui case (-edited embryos in China) illustrates real-world consequences of unsanctioned .
Gene therapy, viral vectors, somatic vs. germline editing, CRISPR basics, reproductive screening. · debate
Day 1 of this lesson. Open this exact section in myPLTW (find it in Clever, Microsoft sign-in), then do the work below.
Do this: Open the debate activity in myPLTW for Lesson 2.2 Our Genetic Future, Activity 2.2.1 (vectors), and review the CER rubric.
Mark the debate activity complete after your CER is posted.
Gene-expression unit should be at 100%; this debate opens the gene-therapy unit.
CER and reflection visible in the course discussion board.
The official PLTW activity stays inside myPLTW. If myPLTW will not open, use F1 and E1-E3 on this page to complete today's local evidence decision, then make up the official activity when access returns. Turn this in at the drop folder with your district Microsoft sign-in, or hand it to Mr. Mendoza in class. Both count as submitted. Doing the activity in myPLTW does not.
Check things off as you work, then submit. This tells Mr. Mendoza how you're doing so he can help the class. It does not replace turning in your producible through the submission route shown below.
Use the code Mr. Mendoza gave you, not your name. Saved on this device.
Gene therapy, viral vectors, somatic vs. germline editing, CRISPR basics, reproductive screening. · Germline editing debate
Open the debate activity in myPLTW for Lesson 2.2 Our Genetic Future, Activity 2.2.1 (vectors), and review the CER rubric.
Gene-expression unit should be at 100%; this debate opens the gene-therapy unit.
This is how Mr. Mendoza sees the class keeping pace with PLTW. Be honest, it only helps if it is accurate.
🎯 Argue a CER position on whether gene editing should ever be permitted in humans.
- Read the case brief in the course shell.
- Write two prepared questions contrasting and risks.
- Draft a CER with a claim, two pieces of evidence, and your reasoning about heritable edits.
- In the debate, note one counterargument about consent of future generations.
- Post your CER and reflection in the course shell.
CER: One CER on whether gene editing should ever be permitted, plus a reflection naming one counterargument about consent of future generations.
Turn this in at the drop folder with your district Microsoft sign-in, or hand it to Mr. Mendoza in class. Both count as submitted. Doing the activity in myPLTW does not. Use the checklist just below and upload by 11:29 PM for full credit. Absent with an excused absence? You get two school days for every day you were absent, so this deadline moves with you.
| Task | Who |
|---|---|
| Read the case brief in the course shell. | _______ |
| Write two prepared questions contrasting and risks. | _______ |
| Draft a CER with a claim, two pieces of evidence, and your reasoning about heritable edits. | _______ |
| In the debate, note one counterargument about consent of future generations. | _______ |
| Post your CER and reflection in the course shell. | _______ |
Working solo? Put your own name in "Who" for every row.
- You'll be able to argue a position on with evidence.
- You'll be able to address the consent problem in your reasoning.
- 1Do thisArgue a CER position on whether germline gene editing should ever be permitted in humans.
- 2Use this resource
- 3Submit thisCER: One CER on whether germline gene editing should ever be permitted, plus a reflection naming one counterargument about consent of future generations.
- 4Submit it here
- 1Open the drop folder.
- 2Sign in with your district Microsoft account, not a personal one.
- 3Upload the file, named Lastname_Firstname__Assignment Title.
- 4Your own upload panel says Uploaded with a green check: that is your receipt.
Turn this in at the drop folder with your district Microsoft sign-in, or hand it to Mr. Mendoza in class. Both count as submitted. Doing the activity in myPLTW does not. Genetics of Disease (Medical Interventions) › Gene therapy, viral vectors, somatic vs. germline editing, CRISPR basics, reproductive screening. › CEROpen the drop folder
Learn it · deck, reading, and vocabulary▸
The deck carries the prior idea forward, lets you inspect an analogy, maps the rule to biology, and ends with the same evidence decision and exit ticket used on this page.
Generated from this lesson's canonical data with a red-team citation check.
Every claim in a scientific report must trace to a specific data value, because a reviewer trusts quantified statements and distrusts vague ones, so anchoring each sentence to a number is what makes the report credible.
A edit is copied into every descendant cell, so the people it changes most are the ones who were never able to consent.
A library keeps a master plan protected while working copies guide production at different stations.
- Why protect the master copy?
- What information moves?
- Where can an error change the final product?
Stored information can be copied, read, and converted into a functional product.
Genes are regulated biological sequences, not conscious instructions, and one gene rarely determines a whole trait alone.
- • Master plan maps to DNA.
- • Working copy maps to RNA.
- • Production output maps to or a regulated cell function.
Driving question: In 2018, He Jiankui edited the CCR5 gene in twin embryos before birth. Those girls will pass that edit to their own children someday. Should any scientist ever be allowed to make a change that no future descendant consented to?
What you already know: Every claim in a scientific report must trace to a specific data value, because a reviewer trusts quantified statements and distrusts vague ones, so anchoring each sentence to a number is what makes the report credible.
New idea: A edit is copied into every descendant cell, so the people it changes most are the ones who were never able to consent.
Visual or model: F1. F1. A lesson illustration or teaching diagram for Germline editing debate. Use it with E1-E3; it is a model or context image, not experimental or patient data. What to notice: Trace the labeled testing, treatment, or biological process and identify where evidence limits the decision.
- Observe or measure the relevant feature in debate.
- Organize the observation with a stable evidence ID.
- Apply this rule: Stored information can be copied, read, and converted into a functional product.
- Choose the option the evidence supports and state the limit of the conclusion.
Real biomedical example: Genetic-testing teams audit whether consent, sample identity, result interpretation, and follow-up evidence are documented before a result informs the . Source: MedlinePlus: What is genetic testing?.
What the evidence supports: E1-E3 and F1 support the daily take-home when the response meets the stated success criteria.
What it cannot prove: The package does not support claims beyond this lesson's or any real patient diagnosis.
- • : Treating disease by adding, silencing, or correcting a gene in a patient's cells.
- • vector: A that delivers genetic material into a cell, such as a or virus, or an organism like a mosquito that spreads a disease.
- • : A gene-editing tool that uses a guide RNA to steer the Cas9 to a chosen DNA site and cut it, so a sequence can be changed.
- • : Relating to the ordinary body cells other than egg and sperm; changes in these cells affect only the individual and are not inherited.
- • : The egg, sperm, and the cells that make them; changes in these cells can be passed to a person's children.
- • : An unintended effect when a drug or gene-editing tool acts on something other than its intended target, which can cause side effects.
- • : Agreeing to a treatment or study only after truly understanding its purpose, risks, benefits, and alternatives; the understanding, not the signature, is the ethics.
Use it now: Choose one decision option. Cite E1 and E3, then explain how the rule connects the evidence to your choice.
Go further, optional: The source links below are optional enrichment. Every fact required for today's local evidence decision appears in this lesson package.
edits affect egg, sperm, or cells and are inherited by all descendant cells and future generations.
Limit: E1 supplies context or an observation; it does not by itself establish the explanation.
A edit is copied into every descendant cell, so the people it changes most are the ones who were never able to consent.
Limit: E2 is a teaching statement or comparison and must be checked against the task evidence.
You'll be able to argue a position on with evidence.
Limit: E3 supports only the result or product criterion named here; it cannot justify a broader clinical or causal claim.
PLTW-GEND-2026-10-26 · Simulated classroom evidence scenario
Your role: medical interventions team member
Decision: Your team must decide what the evidence from debate supports before submitting the claim-evidence-reasoning response named on the lesson page.
- • Select the option best supported by E1-E3.
- • Select a reasonable alternative and name the evidence it would require.
- • Delay the claim because the evidence does not distinguish the options.
Response: State one choice, cite at least two evidence IDs, explain the rule that connects them, and add one limitation. Submit it as the claim-evidence-reasoning response.
Claim ceiling: The supplied lesson evidence can support an observation, pattern, classroom mechanism, or next-step decision about debate. It cannot by itself prove causation, establish a real clinical diagnosis, or justify action outside this classroom task.
Reason for review: Your team must decide what the evidence from debate supports before submitting the claim-evidence-reasoning response named on the lesson page.
Context: A gene edit is not just a medical choice; it is a decision about consent, because a edit is inherited by people who were never asked and cannot ever say no.
- • T1: Read the case brief in the course shell.
- • T2: Write two prepared questions contrasting and risks.
- • T3: Draft a CER with a claim, two pieces of evidence, and your reasoning about heritable edits.
- • T4: In the debate, note one counterargument about consent of future generations.
- • T5: Post your CER and reflection in the course shell.
- • E1: edits affect egg, sperm, or cells and are inherited by all descendant cells and future generations.
- • E2: A edit is copied into every descendant cell, so the people it changes most are the ones who were never able to consent.
- • E3: You'll be able to argue a position on with evidence.
Measurements: No patient measurement is supplied unless it appears explicitly in E1-E3 or F1. Do not invent a value.
Figure finding: Teaching diagram for debate. Trace the labeled testing, treatment, or biological process and identify where evidence limits the decision. This is a teaching model, not patient or experimental data.
Uncertainty: This is a composite classroom scenario. Missing history, measurements, or confirmation tests remain unknown and limit the conclusion.
Students often think Students often assume all gene editing is the same, so if is allowed, must be fine too.. The trap: and edits are not the same, because a somatic edit stops with the patient while a germline edit is copied into egg, sperm, or cells and inherited by every descendant. That is the trap: an edit that helps one consenting adult is a very different act from one that rewrites people who do not yet exist.
Claim: Expanding newborn genetic screening to report adult-onset disease risks should not be made routine under current conditions, though the core panel that catches treatable childhood conditions should continue.\n\nEvidence 1: Every baby born in the United States already gets a heel-stick blood test, and the standard panel screens for conditions like PKU and sickle cell disease that can be treated in early childhood if caught right away.\n\nEvidence 2: When pilot programs added whole-genome sequencing that also flagged adult-onset risks, such as certain cancer or heart-disease genes, they surfaced findings the child could not act on for decades and that the newborn obviously could not consent to learning.\n\nReasoning: Because the newborn cannot consent, and because an adult-onset result becomes part of that person's record for life whether or not they ever wanted to know it, the lasting burden of unwanted information outweighs the benefit when the child cannot act on it for years. Screening that leads to treatment in childhood clears that bar, but screening for risks the child cannot use should wait until safeguards and the person's own choice are in place.\n\nReflection: One counterargument is that flagging an adult-onset risk at birth could let a family plan early and catch a disease sooner. I weighed it seriously, but kept my claim, because the newborn never chose to carry that knowledge, and a benefit to the family does not close the gap that the child never consented.
This model shows the level of evidence and organization needed to complete: Parallel model that shows the full CER format (claim, two pieces of evidence, reasoning, and a reflection naming one counterargument) for a different bioethics case, so students can mirror the structure without seeing an answer to today's germline editing prompt.
- Write one defensible claim.
- Choose specific evidence that supports the claim.
- Explain the scientific rule that connects the evidence to the claim.
Keep the structure. Replace the question, facts, measurements, and evidence. Then recheck units, vocabulary, and whether the conclusion goes beyond the evidence.
Also due today: Post your CER and reflection to the PLTW course shell.
- CER:
- Claim, Evidence, Reasoning: make a claim, back it with evidence, explain your reasoning.
- SOP:
- Standard Operating Procedure, the exact steps to follow (especially in a lab).
- Tracker:
- Your PLTW progress log where you record completed evidence.
- myPLTW:
- The PLTW course site where you do the online activities. Find it in Clever with your Microsoft sign-in, right next to Schoology.
Tap the speaker to hear a term. Add two of these to your notebook glossary with a definition and an example in your own words.
Pick just 2 or 3 words from today and make them yours: write what each one means in your own words, name the context clue or evidence that helped, then give one example from what you actually did in Germline editing debate. Try your own words first; the glossary is there if you get stuck. This is voluntary and counts as extra credit, so keep it short.
Saved on this device. Show Mr. Mendoza or add these to your notebook glossary to claim the extra credit.
Classroom documents for this lesson are posted in Schoology. Open Clever, then Schoology, and find each one by the name shown on its card.
Use this if you were absent, got stuck, or need another pass before you submit the lesson artifact.
Placement rationale
Matched , , reproductive ethics by path:Medical-Interventions/Unit-2_How-to-Screen-Your-Genes/2.2_Our-Genetic-Future; keywords:gene therapy, reproductive. Score 138. Visibility: student-schoology (student-facing resource; link through Schoology rather than local path).
Open this when the class reaches this activity and use it to complete the required lesson artifact.
Placement rationale
Matched , , reproductive ethics by path:Medical-Interventions/Unit-2_How-to-Screen-Your-Genes/2.2_Our-Genetic-Future; keywords:ethics, reproductive. Score 138. Visibility: student-schoology (student-facing resource; link through Schoology rather than local path).
Use this after the required lesson work when you are ready for a harder application or a deeper connection.
Placement rationale
Matched , , reproductive ethics by path:Medical-Interventions/Unit-2_How-to-Screen-Your-Genes/00_Unit-Overview; keywords:gene therapy, crispr. Score 134. Visibility: student-schoology (student-facing resource; link through Schoology rather than local path).
How to get there: open Clever and sign in with your Microsoft (district) account. Both myPLTW and Schoology are in Clever. Do the activity in myPLTW. Turn the work in on this site or hand it to Mr. Mendoza, because that is the step that counts as submitted. Schoology only shows your report-card grade later.
Check yourself · commit, then reveal▸
Claim ceiling for this check: The supplied lesson evidence can support an observation, pattern, classroom mechanism, or next-step decision about debate. It cannot by itself prove causation, establish a real clinical diagnosis, or justify action outside this classroom task.
A doctor edits a gene in a patient's liver to treat a disease. Will the patient's children inherit that edit? Explain why or why not.
Write an answer and pick a confidence to unlock the key.
Fast retrieval with instant answers, not the commit-then-reveal check above. Try each from memory first: write what you remember about the earlier units, then check yourself here.
Go further and get help▸
What today's skills lead to. These are real health-science careers this course builds toward. Tap one to see, on the US Department of Labor's O*NET site, what the job actually involves, what it pays, and how fast it is growing.
Missed the live debate? Watch the linked overview and post a written CER on plus your two questions and a reflection in the PLTW course shell.
Then submit your CER. Turn this in at the drop folder with your district Microsoft sign-in, or hand it to Mr. Mendoza in class. Both count as submitted. Doing the activity in myPLTW does not.
Class still runs. Complete the online activity above (it's self-guided). Need the concept taught without a teacher? Use this authoritative explainer:
MedlinePlus: What is gene therapy?You've passed Unit 2, so the optional extra-credit track is open. Complete reserved-unit work from home, including virtual labs, for extra credit. Each item shows its correct submission route.
Open the extra-credit track- CompleteEvery required part of the artifact is present, nothing left blank.
- AccurateThe science and the data are correct and match the evidence.
- Scientific reasoningYou explain your claim with evidence and reasoning (CER), not just an answer.
- Professional communicationClear, organized, labeled, and written the way a clinician or scientist would.
- SubmittedTurned in the right way, on the class site or handed to Mr. Mendoza in class, and confirmed. Not in Schoology: that is where the report-card grade appears later.