

Signs vs symptoms
Safety gate · before any work
- Wear the required PPE, keep the bench clear, handle equipment only as directed, and know where the eyewash, sink, and spill kit are before you start.
- Human samples and data stay private: label with a code, never a name, and dispose of materials in the correct waste container, then wash your hands.
Do now
Tell the difference between signs and symptoms and use both to begin describing a mystery illness.
- Hand in
- Two-column signs-and-symptoms chart from three patient cases, plus a one-sentence disease category prediction.
- Where
- Turn this in at the drop folder with your district Microsoft sign-in, or hand it to Mr. Mendoza in class. Both count as submitted. Doing the activity in myPLTW does not.
You get two school days for every day you were absent, so this deadline moves with you.
A patient walks into a Cleveland clinic saying 'I feel awful and I'm exhausted.' A thermometer reads 39.4 C. Which of those two facts can another doctor check, and which one do you have to take the patient's word for?
Tell the difference between signs and symptoms and use both to begin describing a mystery illness.
- • You will be able to distinguish a sign from a symptom with examples.
- • You will be able to sort clinical clues into signs and symptoms.
- • You will be able to explain why both are useful for diagnosis.
- 'The patient has a rash' versus 'the patient feels dizzy', which one could a nurse confirm without asking the patient, and how?
- Write down one thing about your own health right now that a doctor could measure and one thing only you could report.
- 1Write your own definitions of sign and symptom, then check them against the class definition.
- 2Read three short patient descriptions and underline every sign in one color, symptom in another.
- 3Make a two-column chart sorting all the clues you found into signs and symptoms.
- 4Note which clues a doctor can measure versus which only the patient can report.
- 5Write one sentence explaining why both signs and symptoms matter for diagnosis.
- 6Predict one disease category that might fit the pattern of clues you sorted.
What did this day actually feel like?
Signs vs symptoms
A sign is what someone else can observe. A symptom is what only the patient can report. Fever is a sign, nausea is a symptom.
That distinction runs the whole diagnostic process, because signs can be measured by anyone and symptoms depend entirely on the patient being believed.
Turned in: data table → Data Tables folder
Fiction. There is no such student. The lessons, labs and dates are the real planned course; the student, the classmates and the conversations are invented.
The same day, drawn.
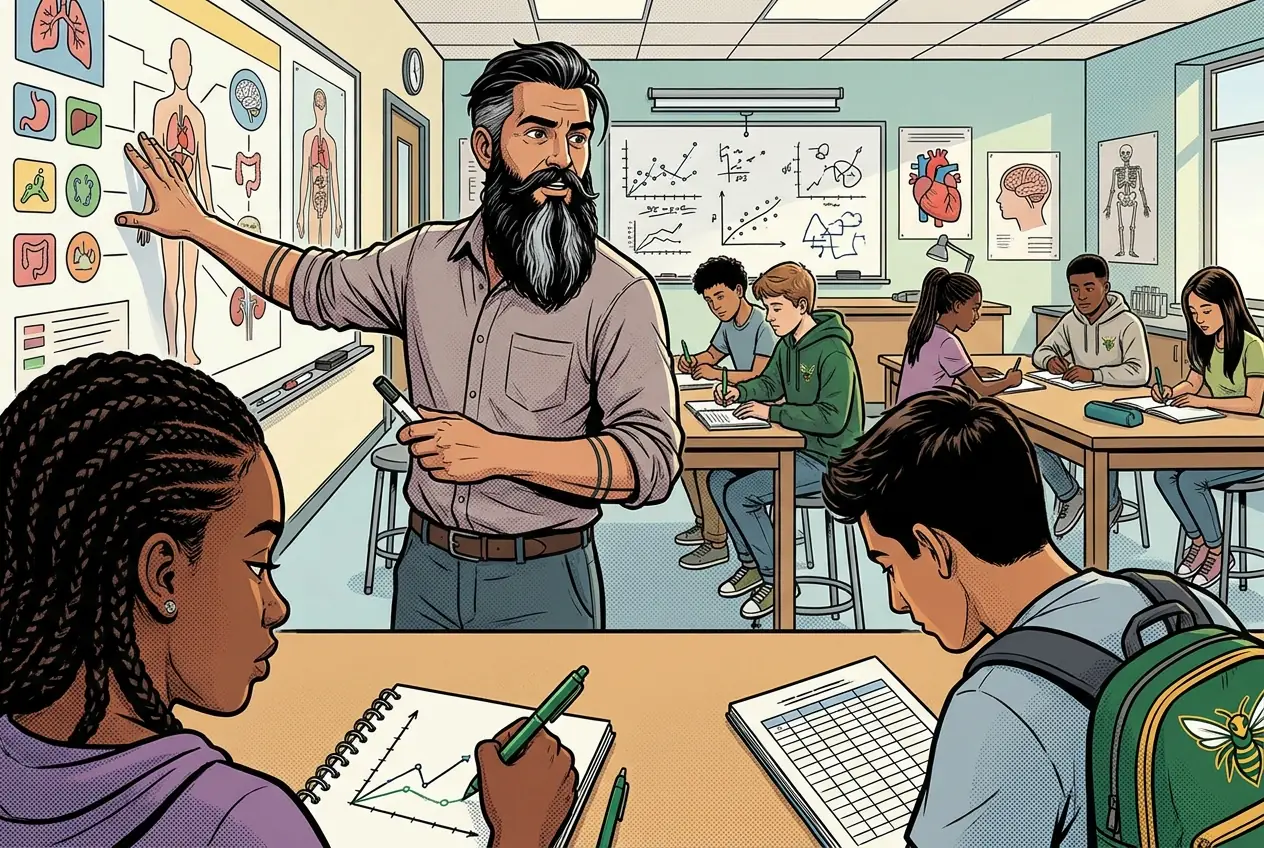
A sign is what someone else can observe. A symptom is what only the patient can report. Fever is a sign, nausea is a symptom.
Fiction. There is no such student. The lessons, labs and dates are the real planned course; the student, the classmates and the conversations are invented.
🛠 Get unstuck · pick your level
Lab day: Tier 1 is the whole class at the bench. No extension today.
🔑 Today's words · 5
Tap a word in the lesson for a plain meaning and one example. Recycled into next week's Do-Now.
Do the work · 80-minute blockfirst 5 min = hook▸
💡 Big idea: Clinicians separate signs from symptoms because measurable findings and reported experiences each catch clues the other misses, so using both together builds a stronger differential than either alone.
- 0-10 minWrite your own definitions of sign and symptom; class compare and correct
- 10-30 minRead three patient descriptions; underline signs (one color) and symptoms (another color)
- 30-45 minBuild the two-column sorting chart; note which clues are measurable vs patient-reported
- 45-60 minWrite one sentence explaining why both types matter for diagnosis
- 60-72 minPredict one disease category that fits the clue pattern; share prediction with a partner
- 72-80 minExit check: read one partner's chart and mark any items they put in the wrong column
- • A detective and a doctor both start the same way: collect clues before deciding what happened.
- • Signs and symptoms are your first set of clues, and mixing them up leads to diagnostic errors that cost lives.
- • Today you practice the sorting skill every medical professional uses in the first minutes with a patient.
- • Exit goal: a two-column chart of signs and symptoms from three patient cases, plus one disease prediction.
- • A sign is an objective, measurable finding (fever temperature, rash visible under a light); a symptom is subjective and reported by the patient (pain, fatigue).
- • Clinicians use both signs and symptoms together because each type of clue catches things the other misses.
- • Sorting clinical clues is the first step in building a .
Outbreak investigation, symptom clusters, pathogen categories, evidence maps. Monday debate: isolation vs. autonomy. · Signs vs symptoms
Day 2 of this lesson. Open this exact section in myPLTW (find it in Clever, Microsoft sign-in), then do the work below.
Do this: Open Activity 1.1.2 Investigating an Outbreak in myPLTW and locate the patient case data with signs and symptoms.
Complete the signs-and-symptoms sorting chart and write your one-sentence disease prediction.
Monday CER should be posted; signs/symptoms chart due today.
Two-column signs and symptoms chart in notebook with prediction sentence.
The official PLTW activity stays inside myPLTW. If myPLTW will not open, use F1 and E1-E3 on this page to complete today's local evidence decision, then make up the official activity when access returns. Turn this in at the drop folder with your district Microsoft sign-in, or hand it to Mr. Mendoza in class. Both count as submitted. Doing the activity in myPLTW does not.
Check things off as you work, then submit. This tells Mr. Mendoza how you're doing so he can help the class. It does not replace turning in your producible through the submission route shown below.
Use the code Mr. Mendoza gave you, not your name. Saved on this device.
Outbreak investigation, symptom clusters, pathogen categories, evidence maps. Monday debate: isolation vs. autonomy. · Signs vs symptoms
Open Activity 1.1.2 Investigating an Outbreak in myPLTW and locate the patient case data with signs and symptoms.
Monday CER should be posted; signs/symptoms chart due today.
This is how Mr. Mendoza sees the class keeping pace with PLTW. Be honest, it only helps if it is accurate.
🎯 Tell the difference between signs and symptoms and use both to begin describing a mystery illness.
- Write your own definitions of sign and symptom, then check them against the class definition.
- Read three short patient descriptions and underline every sign in one color, symptom in another.
- Make a two-column chart sorting all the clues you found into signs and symptoms.
- Note which clues a doctor can measure versus which only the patient can report.
- Write one sentence explaining why both signs and symptoms matter for diagnosis.
- Predict one disease category that might fit the pattern of clues you sorted.
Data table: Two-column signs-and-symptoms chart from three patient cases, plus a one-sentence disease category prediction.
Turn this in at the drop folder with your district Microsoft sign-in, or hand it to Mr. Mendoza in class. Both count as submitted. Doing the activity in myPLTW does not. Use the checklist just below and upload by 11:29 PM for full credit. Absent with an excused absence? You get two school days for every day you were absent, so this deadline moves with you.
| Task | Who |
|---|---|
| Write your own definitions of sign and symptom, then check them against the class definition. | _______ |
| Read three short patient descriptions and underline every sign in one color, symptom in another. | _______ |
| Make a two-column chart sorting all the clues you found into signs and symptoms. | _______ |
| Note which clues a doctor can measure versus which only the patient can report. | _______ |
| Write one sentence explaining why both signs and symptoms matter for diagnosis. | _______ |
| Predict one disease category that might fit the pattern of clues you sorted. | _______ |
Working solo? Put your own name in "Who" for every row.
- You will be able to distinguish a sign from a symptom with examples.
- You will be able to sort clinical clues into signs and symptoms.
- You will be able to explain why both are useful for diagnosis.
- 1Do thisTell the difference between signs and symptoms and use both to begin describing a mystery illness.
- 2Use this resource
- 3Submit thisData table: Two-column signs-and-symptoms chart from three patient cases, plus a one-sentence disease category prediction.
- 4Submit it here
- 1Open the drop folder.
- 2Sign in with your district Microsoft account, not a personal one.
- 3Upload the file, named Lastname_Firstname__Assignment Title.
- 4Your own upload panel says Uploaded with a green check: that is your receipt.
Turn this in at the drop folder with your district Microsoft sign-in, or hand it to Mr. Mendoza in class. Both count as submitted. Doing the activity in myPLTW does not. Genetics of Disease (Medical Interventions) › Outbreak investigation, symptom clusters, pathogen categories, evidence maps. Monday debate: isolation vs. autonomy. › Data tableOpen the drop folder
Learn it · deck, reading, and vocabulary▸
The deck carries the prior idea forward, lets you inspect an analogy, maps the rule to biology, and ends with the same evidence decision and exit ticket used on this page.
Generated from this lesson's canonical data with a red-team citation check.
A community can legally restrict movement during an outbreak because one person's contagion can cost many other people their health, so the freedom of the individual is weighed against the of the group.
Clinicians separate signs from symptoms because measurable findings and reported experiences each catch clues the other misses, so using both together builds a stronger differential than either alone.
An airport checkpoint uses several imperfect checks before deciding what action to take.
- What can each check detect?
- What might create a false alarm?
- Why is one result not always enough?
A decision is stronger when the test fits the question and its limits are known.
Medical decisions also depend on biology, patient context, ethics, and professional judgment.
- • Checkpoint evidence maps to E1-E3.
- • False alarms map to test limitations.
- • The response maps to the justified next intervention or test.
Driving question: A patient walks into a Cleveland clinic saying 'I feel awful and I'm exhausted.' A thermometer reads 39.4 C. Which of those two facts can another doctor check, and which one do you have to take the patient's word for?
What you already know: A community can legally restrict movement during an outbreak because one person's contagion can cost many other people their health, so the freedom of the individual is weighed against the of the group.
New idea: Clinicians separate signs from symptoms because measurable findings and reported experiences each catch clues the other misses, so using both together builds a stronger differential than either alone.
Visual or model: F1. F1. A lesson illustration or teaching diagram for Signs vs symptoms. Use it with E1-E3; it is a model or context image, not experimental or patient data. What to notice: Trace the labeled testing, treatment, or biological process and identify where evidence limits the decision.
- Observe or measure the relevant feature in Signs vs symptoms.
- Organize the observation with a stable evidence ID.
- Apply this rule: A decision is stronger when the test fits the question and its limits are known.
- Choose the option the evidence supports and state the limit of the conclusion.
Real biomedical example: A patient walks into a Cleveland clinic saying 'I feel awful and I'm exhausted.' A thermometer reads 39.4 C. Which of those two facts can another doctor check, and which one do you have to take the patient's word for?
What the evidence supports: E1-E3 and F1 support the daily take-home when the response meets the stated success criteria.
What it cannot prove: The package does not support claims beyond this lesson's or any real patient diagnosis.
- • : A microorganism such as a bacterium, virus, fungus, or parasite that can cause disease in its host.
- • symptom: A sign of illness that a patient feels or notices, such as pain, fever, or fatigue, which helps point toward a diagnosis.
- • sign: An objective indication of disease that someone else can observe or measure, such as a fever, rash, or swelling, unlike a symptom the patient feels.
- • outbreak: A sudden rise in cases of a disease above the normal level in a place or group, often spreading quickly and needing rapid response.
- • epidemiology: The study of how diseases spread, who they affect, and what causes them across populations, used to find patterns and guide prevention.
- • reservoir: A living host or environment where a normally lives and multiplies, serving as the source from which infections spread.
- • vector: A that delivers genetic material into a cell, such as a or virus, or an organism like a mosquito that spreads a disease.
Use it now: Choose one decision option. Cite E1 and E3, then explain how the rule connects the evidence to your choice.
Go further, optional: The source links below are optional enrichment. Every fact required for today's local evidence decision appears in this lesson package.
A sign is an objective, measurable finding (fever temperature, rash visible under a light); a symptom is subjective and reported by the patient (pain, fatigue).
Limit: E1 supplies context or an observation; it does not by itself establish the explanation.
Clinicians separate signs from symptoms because measurable findings and reported experiences each catch clues the other misses, so using both together builds a stronger differential than either alone.
Limit: E2 is a teaching statement or comparison and must be checked against the task evidence.
You will be able to distinguish a sign from a symptom with examples.
Limit: E3 supports only the result or product criterion named here; it cannot justify a broader clinical or causal claim.
PLTW-GEND-2026-09-03 · Simulated classroom evidence scenario
Your role: medical interventions team member
Decision: Your team must decide what the evidence from Signs vs symptoms supports before submitting the labeled and result claim named on the lesson page.
- • Select the option best supported by E1-E3.
- • Select a reasonable alternative and name the evidence it would require.
- • Delay the claim because the evidence does not distinguish the options.
Response: State one choice, cite at least two evidence IDs, explain the rule that connects them, and add one limitation. Submit it as the labeled and result claim.
Claim ceiling: The supplied lesson evidence can support an observation, pattern, classroom mechanism, or next-step decision about Signs vs symptoms. It cannot by itself prove causation, establish a real clinical diagnosis, or justify action outside this classroom task.
Reason for review: Your team must decide what the evidence from Signs vs symptoms supports before submitting the labeled and result claim named on the lesson page.
Context: A diagnosis is only as trustworthy as the clues behind it, so clinicians sort what they can measure from what the patient reports and use both, because each type of clue catches things the other misses.
- • T1: Write your own definitions of sign and symptom, then check them against the class definition.
- • T2: Read three short patient descriptions and underline every sign in one color, symptom in another.
- • T3: Make a two-column chart sorting all the clues you found into signs and symptoms.
- • T4: Note which clues a doctor can measure versus which only the patient can report.
- • T5: Write one sentence explaining why both signs and symptoms matter for diagnosis.
- • T6: Predict one disease category that might fit the pattern of clues you sorted.
- • E1: A sign is an objective, measurable finding (fever temperature, rash visible under a light); a symptom is subjective and reported by the patient (pain, fatigue).
- • E2: Clinicians separate signs from symptoms because measurable findings and reported experiences each catch clues the other misses, so using both together builds a stronger differential than either alone.
- • E3: You will be able to distinguish a sign from a symptom with examples.
Measurements: Use only the measurements, units, graph, or counts supplied in today's task. No additional patient measurement is implied.
Figure finding: Teaching diagram for Signs vs symptoms. Trace the labeled testing, treatment, or biological process and identify where evidence limits the decision. This is a teaching model, not patient or experimental data.
Uncertainty: This is a composite classroom scenario. Missing history, measurements, or confirmation tests remain unknown and limit the conclusion.
Rate or percent = part / comparison total x 100%. Percent change = (new - comparison) / comparison x 100%.
If 18 of 60 records meet a condition, the frequency is 18 / 60 x 100% = 30%.
Name the comparison total. A percent describes the supplied group and does not automatically predict an individual's outcome.
Use today's supplied counts to calculate one rate, risk, frequency, or percent change. Show the denominator and interpretation.
Students often think Students often assume anything the patient tells the doctor counts as a symptom, and anything the doctor writes down counts as a sign.. The trap: The split is not about who is talking, it is about whether the clue is objective and measurable. A fever the patient mentions is still a sign once it is measured, and pain a doctor records is still a symptom because only the patient can feel it. Sorting by 'who said it' instead of 'can it be measured' will scramble your whole differential.
From three patient cases, I sorted each clue by whether a doctor can measure it (sign) or only the patient can report it (symptom).
Why both matter: signs give measurable evidence anyone can verify, while symptoms reveal what the patient is experiencing that a test might miss, so together they point toward a diagnosis.
Prediction: the fever plus rash pattern fits an infectious (pathogen-caused) illness, so I would start there.
| Clue | Sign or Symptom | Who detects it |
|---|---|---|
| Temperature 39.4 C | Sign | Measured with a thermometer |
| Visible red rash | Sign | Seen by clinician |
| Feeling tired | Symptom | Reported by patient |
| Headache | Symptom | Reported by patient |
| Fast heart rate | Sign | Measured with a pulse check |
This model shows the level of evidence and organization needed to complete: A two-column chart sorting clinical clues from patient cases into objective signs and subjective symptoms, with a one-sentence disease-category prediction.
- Name the variables and include units.
- Enter observations without changing the raw values.
- Check labels, calculations, and patterns before interpreting the data.
Keep the structure. Replace the question, facts, measurements, and evidence. Then recheck units, vocabulary, and whether the conclusion goes beyond the evidence.
Also due today: Keep in notebook; photograph and upload to portfolio by Friday.
- CER:
- Claim, Evidence, Reasoning: make a claim, back it with evidence, explain your reasoning.
- SOP:
- Standard Operating Procedure, the exact steps to follow (especially in a lab).
- Tracker:
- Your PLTW progress log where you record completed evidence.
- myPLTW:
- The PLTW course site where you do the online activities. Find it in Clever with your Microsoft sign-in, right next to Schoology.
Tap the speaker to hear a term. Add two of these to your notebook glossary with a definition and an example in your own words.
Pick just 2 or 3 words from today and make them yours: write what each one means in your own words, name the context clue or evidence that helped, then give one example from what you actually did in Signs vs symptoms. Try your own words first; the glossary is there if you get stuck. This is voluntary and counts as extra credit, so keep it short.
Saved on this device. Show Mr. Mendoza or add these to your notebook glossary to claim the extra credit.
Classroom documents for this lesson are posted in Schoology. Open Clever, then Schoology, and find each one by the name shown on its card.
Use this if you were absent, got stuck, or need another pass before you submit the lesson artifact.
Placement rationale
Matched Outbreak investigation and case framing by path:Medical-Interventions/Unit-1_How-to-Fight-Infection/1.1_The-Mystery-Infection; keywords:outbreak, . Score 142. Visibility: student-schoology (student-facing resource; link through Schoology rather than local path).
Use this if you were absent, got stuck, or need another pass before you submit the lesson artifact.
Placement rationale
Matched Outbreak investigation and case framing by path:Medical-Interventions/Unit-1_How-to-Fight-Infection/1.1_The-Mystery-Infection; keywords:outbreak, case. Score 138. Visibility: student-schoology (student-facing resource; link through Schoology rather than local path).
Use this after the required lesson work when you are ready for a harder application or a deeper connection.
Placement rationale
Matched Outbreak investigation and case framing by path:Medical-Interventions/Unit-1_How-to-Fight-Infection/00_Unit-Overview; keywords:outbreak, . Score 134. Visibility: student-schoology (student-facing resource; link through Schoology rather than local path).
How to get there: open Clever and sign in with your Microsoft (district) account. Both myPLTW and Schoology are in Clever. Do the activity in myPLTW. Turn the work in on this site or hand it to Mr. Mendoza, because that is the step that counts as submitted. Schoology only shows your report-card grade later.
Check yourself · commit, then reveal▸
Claim ceiling for this check: The supplied lesson evidence can support an observation, pattern, classroom mechanism, or next-step decision about Signs vs symptoms. It cannot by itself prove causation, establish a real clinical diagnosis, or justify action outside this classroom task.
A patient reports 'I've been so tired for a week.' The clinician records a resting heart rate of 110 beats per minute. Label each of the two clues as a sign or a symptom and explain how you decided.
Write an answer and pick a confidence to unlock the key.
Fast retrieval with instant answers, not the commit-then-reveal check above. Try each from memory first: write what you remember about the earlier units, then check yourself here.
Go further and get help▸
I can name the procedure's purpose and the evidence I will record. I can identify each named hazard and the control that reduces it: Wear the required PPE, keep the bench clear, handle equipment only as directed, and know where the eyewash, sink, and spill kit are before you start. My data table is ready before materials are handled.
Finish the checklist before you handle any material.
- • Wear the required PPE, keep the bench clear, handle equipment only as directed, and know where the eyewash, sink, and spill kit are before you start.
- • Human samples and data stay private: label with a code, never a name, and dispose of materials in the correct waste container, then wash your hands.
- 1Before materials are handled, identify the purpose, variables or comparison, controls, measurement units, and stop-work condition.
- 2Write your own definitions of sign and symptom, then check them against the class definition.
- 3Read three short patient descriptions and underline every sign in one color, symptom in another.
- 4Make a two-column chart sorting all the clues you found into signs and symptoms.
- 5Note which clues a doctor can measure versus which only the patient can report.
- 6Write one sentence explaining why both signs and symptoms matter for diagnosis.
- 7Predict one disease category that might fit the pattern of clues you sorted.
- 8Record each result in the prepared table before interpreting it. Mark missing, repeated, or invalid results truthfully.
- 9Complete the named cleanup and waste route, remove PPE safely, wash hands when required, and confirm the station is ready for the next group.
| Trial or sample ID | Independent condition | Measured result with units | Observation before interpretation | Quality-control note |
|---|---|---|---|---|
Before the procedure, predict the result and cite the rule behind the prediction.
After the procedure, compare the result with the prediction and name one limitation or source of uncertainty.
What today's skills lead to. These are real health-science careers this course builds toward. Tap one to see, on the US Department of Labor's O*NET site, what the job actually involves, what it pays, and how fast it is growing.
Today is individual work you can do from home: complete the same target above, then submit your Data table.
Open the drop folderTurn this in at the drop folder with your district Microsoft sign-in, or hand it to Mr. Mendoza in class. Both count as submitted. Doing the activity in myPLTW does not.
Class still runs. Complete the online activity above (it's self-guided). Need the concept taught without a teacher? Use this authoritative explainer:
CDC: Principles of Epidemiology (self-study)- CompleteEvery required part of the artifact is present, nothing left blank.
- AccurateThe science and the data are correct and match the evidence.
- Scientific reasoningYou explain your claim with evidence and reasoning (CER), not just an answer.
- Professional communicationClear, organized, labeled, and written the way a clinician or scientist would.
- SubmittedTurned in the right way, on the class site or handed to Mr. Mendoza in class, and confirmed. Not in Schoology: that is where the report-card grade appears later.
- Error analysis and method · counts doubleName a specific limit of the method and how it moved your result, and compare what you predicted to what happened. "Human error" does not count; say what about the procedure or instrument caused it.