
SDS-PAGE gel results
Safety gate · before any work
- No new chemical hazards today; gel image analysis is a paper or digital exercise.
- If handling a physical stained gel, wear gloves as Coomassie stain is a skin irritant.
- Dispose of any staining waste according to lab guidelines.
Do now
Read an SDS-PAGE gel to judge the size and purity of your isolated protein.
- Hand in
- Annotated SDS-PAGE gel image with labeled marker lane, estimated protein size, band counts by fraction, most-pure fraction identified, and a QC statement.
- Where
- Turn this in at the drop folder with your district Microsoft sign-in, or hand it to Mr. Mendoza in class. Both count as submitted. Doing the activity in myPLTW does not.
You get two school days for every day you were absent, so this deadline moves with you.
Your fractions glowed green yesterday, but did you actually purify the target, or did contaminants ride along? What do the bands on your SDS-PAGE gel say?
Read an SDS-PAGE gel to judge the size and of your isolated .
- • You'll be able to estimate size against a marker lane.
- • You'll be able to judge and write a QC statement from a gel.
- On an SDS-PAGE gel, do smaller proteins travel farther down the gel or stay near the top? Why?
- If your target fraction shows one strong band plus three faint extra bands, is it pure? What do the extra bands represent?
- 1Read the gel-interpretation notes in the PLTW course shell and define the lane.
- 2Compare your fraction lanes to the marker to estimate your 's size.
- 3Decide which fraction is most pure based on how few extra bands it shows.
- 4Write one QC statement on whether the met the goal.
- 5Add your annotated gel reading to your Unit 4 PLTW tracker evidence.
What did this day actually feel like?
SDS-PAGE gel results
Running the fractions on a gel to see what is actually in each one. Purity is visible as the other bands disappearing.
My best fraction still had two faint contaminant bands, which is honest and went in the report.
Turned in: data table → Data Tables folder
Fiction. There is no such student. The lessons, labs and dates are the real planned course; the student, the classmates and the conversations are invented.
The same day, drawn.
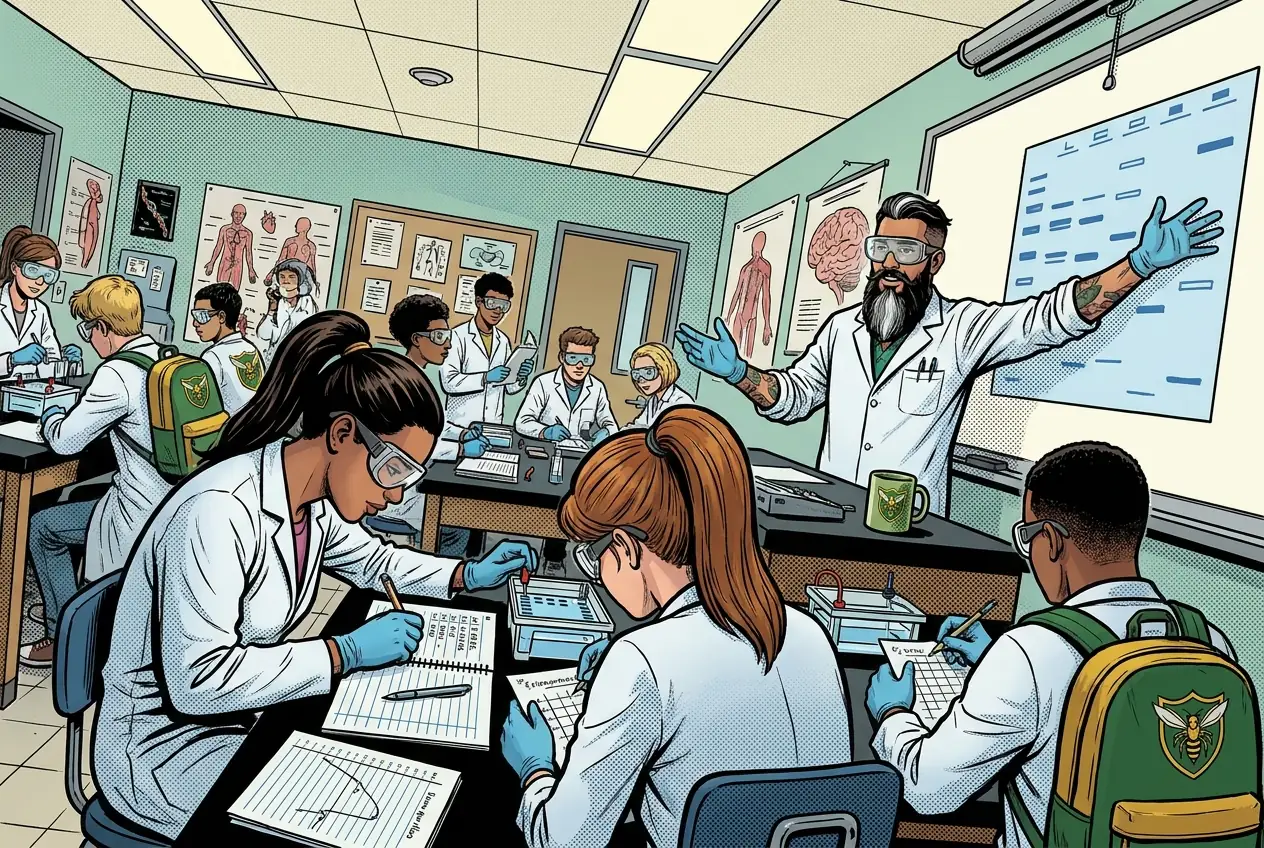
Running the fractions on a gel to see what is actually in each one. Purity is visible as the other bands disappearing.
Fiction. There is no such student. The lessons, labs and dates are the real planned course; the student, the classmates and the conversations are invented.
🛠 Get unstuck · pick your level
Lab day: Tier 1 is the whole class at the bench. No extension today.
🔑 Today's words · 5
Tap a word in the lesson for a plain meaning and one example. Recycled into next week's Do-Now.
Do the work · 80-minute blockfirst 5 min = hook▸
💡 Big idea: SDS-PAGE sorts proteins by size alone because SDS erases charge and shape, so the band pattern reveals both your target's molecular weight and how many contaminants remain.
- 0-10Read gel-interpretation notes; define marker lane and band
- 10-28Annotate gel image: label marker lane, estimate target size
- 28-45Compare fraction lanes; count extra bands per lane
- 45-58Identify most-pure fraction; justify with band count
- 58-70Write QC statement: passed or failed goal with evidence
- 70-80Add annotated gel to tracker; preview Friday lab report
- • You collected fractions yesterday; today you find out what is actually in them.
- • SDS-PAGE separates proteins by size and makes every contaminant visible as a band.
- • A clean gel with one band says your worked; extra bands say it did not.
- • Gel interpretation is a core Lab SOPs skill tested on the 072130 WebXam.
- • SDS denatures proteins and gives all of them a uniform negative charge proportional to size.
- • Smaller proteins migrate farther through the gel matrix in a given time.
- • A pure target fraction shows one dominant band at the expected molecular weight.
GFP, chromatography, SDS-PAGE / gel interpretation, purity and QC. · SDS-PAGE gel results
Day 4 of this lesson. Open this exact section in myPLTW (find it in Clever, Microsoft sign-in), then do the work below.
Do this: Open Activity 4.1.4 in myPLTW and interpret your SDS-PAGE gel to judge size and of the isolated protein.
Mark the SDS-PAGE entry complete and attach your annotated gel image and QC statement.
Fraction-collection data should be done (Wednesday); annotated gel and QC statement due today.
Annotated SDS-PAGE gel with marker lane, size estimate, band counts, and QC statement submitted.
The official PLTW activity stays inside myPLTW. If myPLTW will not open, use F1 and E1-E3 on this page to complete today's local evidence decision, then make up the official activity when access returns. Turn this in at the drop folder with your district Microsoft sign-in, or hand it to Mr. Mendoza in class. Both count as submitted. Doing the activity in myPLTW does not.
Check things off as you work, then submit. This tells Mr. Mendoza how you're doing so he can help the class. It does not replace turning in your producible through the submission route shown below.
Use the code Mr. Mendoza gave you, not your name. Saved on this device.
GFP, chromatography, SDS-PAGE / gel interpretation, purity and QC. · SDS-PAGE gel results
Open Activity 4.1.4 in myPLTW and interpret your SDS-PAGE gel to judge size and of the isolated protein.
Fraction-collection data should be done (Wednesday); annotated gel and QC statement due today.
This is how Mr. Mendoza sees the class keeping pace with PLTW. Be honest, it only helps if it is accurate.
🎯 Read an SDS-PAGE gel to judge the size and of your isolated .
- Read the gel-interpretation notes in the PLTW course shell and define the lane.
- Compare your fraction lanes to the marker to estimate your 's size.
- Decide which fraction is most pure based on how few extra bands it shows.
- Write one QC statement on whether the met the goal.
- Add your annotated gel reading to your Unit 4 PLTW tracker evidence.
Data table: Annotated SDS-PAGE gel image with labeled marker lane, estimated size, band counts by fraction, most-pure fraction identified, and a QC statement.
Turn this in at the drop folder with your district Microsoft sign-in, or hand it to Mr. Mendoza in class. Both count as submitted. Doing the activity in myPLTW does not. Use the checklist just below and upload by 11:29 PM for full credit. Absent with an excused absence? You get two school days for every day you were absent, so this deadline moves with you.
| Task | Who |
|---|---|
| Read the gel-interpretation notes in the PLTW course shell and define the lane. | _______ |
| Compare your fraction lanes to the marker to estimate your 's size. | _______ |
| Decide which fraction is most pure based on how few extra bands it shows. | _______ |
| Write one QC statement on whether the met the goal. | _______ |
| Add your annotated gel reading to your Unit 4 PLTW tracker evidence. | _______ |
Working solo? Put your own name in "Who" for every row.
- You'll be able to estimate size against a marker lane.
- You'll be able to judge and write a QC statement from a gel.
- 1Do thisRead an SDS-PAGE gel to judge the size and purity of your isolated protein.
- 2Use this resource
- 3Submit thisData table: Annotated SDS-PAGE gel image with labeled marker lane, estimated protein size, band counts by fraction, most-pure fraction identified, and a QC statement.
- 4Submit it here
- 1Open the drop folder.
- 2Sign in with your district Microsoft account, not a personal one.
- 3Upload the file, named Lastname_Firstname__Assignment Title.
- 4Your own upload panel says Uploaded with a green check: that is your receipt.
Turn this in at the drop folder with your district Microsoft sign-in, or hand it to Mr. Mendoza in class. Both count as submitted. Doing the activity in myPLTW does not. Genetics of Disease (Medical Interventions) › GFP, chromatography, SDS-PAGE / gel interpretation, purity and QC. › Data tableOpen the drop folder
Learn it · deck, reading, and vocabulary▸
The deck carries the prior idea forward, lets you inspect an analogy, maps the rule to biology, and ends with the same evidence decision and exit ticket used on this page.
Generated from this lesson's canonical data with a red-team citation check.
Column physically isolates the target because only it binds the resin tightly, so contaminants wash out first and the target elutes last into the glowing fractions.
SDS-PAGE sorts proteins by size alone because SDS erases charge and shape, so the band pattern reveals both your target's molecular weight and how many contaminants remain.
A pilot uses a preflight checklist before the aircraft moves.
- Which checks happen before action?
- Which hazard does each check control?
- What happens if a familiar step is skipped?
A routine works when each action controls a named hazard before exposure begins.
A laboratory hazard can change during a procedure, so students must keep monitoring conditions after the checklist.
- • Preflight checks map to PPE and setup.
- • Aircraft hazards map to chemical, biological, heat, or sharps hazards.
- • Go or no-go maps to the pre-lab readiness decision.
Driving question: Your fractions glowed green yesterday, but did you actually purify the target, or did contaminants ride along? What do the bands on your SDS-PAGE gel say?
What you already know: Column physically isolates the target because only it binds the resin tightly, so contaminants wash out first and the target elutes last into the glowing fractions.
New idea: SDS-PAGE sorts proteins by size alone because SDS erases charge and shape, so the band pattern reveals both your target's molecular weight and how many contaminants remain.
Visual or model: F1. F1. A lesson illustration or teaching diagram for SDS-PAGE gel results. Use it with E1-E3; it is a model or context image, not experimental or patient data. What to notice: Trace the labeled testing, treatment, or biological process and identify where evidence limits the decision.
- Observe or measure the relevant feature in SDS-PAGE gel results.
- Organize the observation with a stable evidence ID.
- Apply this rule: A routine works when each action controls a named hazard before exposure begins.
- Choose the option the evidence supports and state the limit of the conclusion.
Real biomedical example: Your fractions glowed green yesterday, but did you actually purify the target, or did contaminants ride along? What do the bands on your SDS-PAGE gel say?
What the evidence supports: E1-E3 and F1 support the daily take-home when the response meets the stated success criteria.
What it cannot prove: The package does not support claims beyond this lesson's or any real patient diagnosis.
- • GFP: Green fluorescent , taken from a jellyfish, that glows green under blue or ultraviolet light and is used to tag and watch cells or genes.
- • : A lab technique that separates a mixture into its parts based on how fast each component travels through a material like paper or a gel.
- • : The step in a separation method where a solvent washes the target molecule off a column or material so it can be collected in pure form.
- • : A specific whose presence signals a particular cell type, disease, or biological state, used to identify or track it.
- • : How free a sample is from contaminating substances, often given as the percentage of the sample that is the intended compound.
- • QC: Quality control, the routine checks and known samples used in a lab to confirm tests and instruments are working correctly and giving reliable results.
Use it now: Choose one decision option. Cite E1 and E3, then explain how the rule connects the evidence to your choice.
Go further, optional: The source links below are optional enrichment. Every fact required for today's local evidence decision appears in this lesson package.
SDS denatures proteins and gives all of them a uniform negative charge proportional to size.
Limit: E1 supplies context or an observation; it does not by itself establish the explanation.
SDS-PAGE sorts proteins by size alone because SDS erases charge and shape, so the band pattern reveals both your target's molecular weight and how many contaminants remain.
Limit: E2 is a teaching statement or comparison and must be checked against the task evidence.
You'll be able to estimate size against a marker lane.
Limit: E3 supports only the result or product criterion named here; it cannot justify a broader clinical or causal claim.
PLTW-GEND-2026-12-03 · Simulated classroom evidence scenario
Your role: medical interventions team member
Decision: Your team must decide what the evidence from SDS-PAGE gel results supports before submitting the labeled and result claim named on the lesson page.
- • Proceed because the readiness evidence is complete.
- • Pause and correct the named setup or gap.
- • Repeat the measurement because quality controls are not acceptable.
Response: State one choice, cite at least two evidence IDs, explain the rule that connects them, and add one limitation. Submit it as the labeled and result claim.
Claim ceiling: The supplied lesson evidence can support an observation, pattern, classroom mechanism, or next-step decision about SDS-PAGE gel results. It cannot by itself prove causation, establish a real clinical diagnosis, or justify action outside this classroom task.
Mean = sum of values / number of values. Median = middle ordered value. Range = maximum - minimum.
For 2, 4, 4, and 10: mean = 20 / 4 = 5, median = 4, and range = 10 - 2 = 8.
Mean, median, and range keep the measurement unit. Order the values before finding the median.
Calculate the requested summary for today's supplied values, then write what it reveals and what it hides.
Students often think Students think proteins separate on the gel by their natural charge or shape, so the biggest or most-charged one moves fastest.. The trap: SDS coats every with a uniform negative charge and unfolds them, so charge and shape are erased. Separation is by size alone, and smaller proteins migrate farther because they slip through the gel matrix more easily.
How I read the gel: the marker (ladder) lane has bands of known molecular weights, so I use it as a ruler. Smaller proteins migrate farther down the gel, so I compare how far my band traveled to the marker to estimate size.
Reading:
- My target band lines up near the 27 kDa marker band, so I estimate the protein is about 27 kDa.
- Fraction 4 shows one strong band with almost no extra bands; fraction 2 shows several bands. So fraction 4 is the most pure.
QC statement: the purification met the purity goal, because the target fraction shows one dominant band at the expected size with very few contaminant bands, which is what a pure sample looks like.
| Lane | Bands seen | Estimated size | Note |
|---|---|---|---|
| Marker | Ladder of known sizes | reference | used as ruler |
| Fraction 2 | Several bands | mixed | impure, many contaminants |
| Fraction 4 | One dominant band | about 27 kDa | most pure, meets goal |
This model shows the level of evidence and organization needed to complete: Completes the gel-interpretation task: an annotated SDS-PAGE reading with a labeled marker lane, estimated protein size, band counts by fraction, the most-pure fraction identified, and a QC statement.
- Name the variables and include units.
- Enter observations without changing the raw values.
- Check labels, calculations, and patterns before interpreting the data.
Keep the structure. Replace the question, facts, measurements, and evidence. Then recheck units, vocabulary, and whether the conclusion goes beyond the evidence.
Also due today: Attach your annotated gel reading to your Unit 4 PLTW tracker and submit it to the class site.
- CER:
- Claim, Evidence, Reasoning: make a claim, back it with evidence, explain your reasoning.
- SOP:
- Standard Operating Procedure, the exact steps to follow (especially in a lab).
- Tracker:
- Your PLTW progress log where you record completed evidence.
- myPLTW:
- The PLTW course site where you do the online activities. Find it in Clever with your Microsoft sign-in, right next to Schoology.
Tap the speaker to hear a term. Add two of these to your notebook glossary with a definition and an example in your own words.
Pick just 2 or 3 words from today and make them yours: write what each one means in your own words, name the context clue or evidence that helped, then give one example from what you actually did in SDS-PAGE gel results. Try your own words first; the glossary is there if you get stuck. This is voluntary and counts as extra credit, so keep it short.
Saved on this device. Show Mr. Mendoza or add these to your notebook glossary to claim the extra credit.
Classroom documents for this lesson are posted in Schoology. Open Clever, then Schoology, and find each one by the name shown on its card.
Open this when the class reaches this activity and use it to complete the required lesson artifact.
Placement rationale
Matched and quality control by path:Medical-Interventions/Unit-4_When-Organs-Fail/4.1_Manufacturing-Human-Proteins; keywords:protein purification, gfp, . Score 150. Visibility: student-schoology (student-facing resource; link through Schoology rather than local path).
Open this when the class reaches this activity and use it to complete the required lesson artifact.
Placement rationale
Matched and quality control by path:Medical-Interventions/Unit-4_When-Organs-Fail/4.1_Manufacturing-Human-Proteins; keywords:protein purification, gfp, . Score 150. Visibility: student-schoology (student-facing resource; link through Schoology rather than local path).
Use this if you were absent, got stuck, or need another pass before you submit the lesson artifact.
Placement rationale
Matched and quality control by path:Medical-Interventions/Unit-4_When-Organs-Fail/4.1_Manufacturing-Human-Proteins; keywords:gfp, . Score 142. Visibility: student-schoology (student-facing resource; link through Schoology rather than local path).
How to get there: open Clever and sign in with your Microsoft (district) account. Both myPLTW and Schoology are in Clever. Do the activity in myPLTW. Turn the work in on this site or hand it to Mr. Mendoza, because that is the step that counts as submitted. Schoology only shows your report-card grade later.
Check yourself · commit, then reveal▸
Claim ceiling for this check: The supplied lesson evidence can support an observation, pattern, classroom mechanism, or next-step decision about SDS-PAGE gel results. It cannot by itself prove causation, establish a real clinical diagnosis, or justify action outside this classroom task.
Your best fraction shows one dark band at the expected molecular weight and two faint bands higher up (larger proteins). Is this fraction pure enough to call a success, and what are the two faint bands?
Write an answer and pick a confidence to unlock the key.
Fast retrieval with instant answers, not the commit-then-reveal check above. Try each from memory first: write what you remember about the earlier units, then check yourself here.
Go further and get help▸
I can name the procedure's purpose and the evidence I will record. I can identify each named hazard and the control that reduces it: No new chemical hazards today; gel image analysis is a paper or digital exercise. My data table is ready before materials are handled.
Finish the checklist before you handle any material.
- • No new chemical hazards today; gel image analysis is a paper or digital exercise.
- • If handling a physical stained gel, wear gloves as Coomassie stain is a skin irritant.
- • Dispose of any staining waste according to lab guidelines.
- 1Before materials are handled, identify the purpose, variables or comparison, controls, measurement units, and stop-work condition.
- 2Read the gel-interpretation notes in the PLTW course shell and define the protein marker lane.
- 3Compare your fraction lanes to the marker to estimate your protein's size.
- 4Decide which fraction is most pure based on how few extra bands it shows.
- 5Write one QC statement on whether the purification met the purity goal.
- 6Add your annotated gel reading to your Unit 4 PLTW tracker evidence.
- 7Record each result in the prepared table before interpreting it. Mark missing, repeated, or invalid results truthfully.
- 8Complete the named cleanup and waste route, remove PPE safely, wash hands when required, and confirm the station is ready for the next group.
| Trial or sample ID | Independent condition | Measured result with units | Observation before interpretation | Quality-control note |
|---|---|---|---|---|
Before the procedure, predict the result and cite the rule behind the prediction.
After the procedure, compare the result with the prediction and name one limitation or source of uncertainty.
What today's skills lead to. These are real health-science careers this course builds toward. Tap one to see, on the US Department of Labor's O*NET site, what the job actually involves, what it pays, and how fast it is growing.
The bench work needs equipment you do not have at home. Do the thinking half now: read the procedure, write your prediction, and set up your data table so it is ready.
Back in class. Ask Mr. Mendoza for the class data set, or for a bench slot to run it yourself. Do not submit a Data table with invented numbers.
Class still runs. Complete the online activity above (it's self-guided). Need the concept taught without a teacher? Use this authoritative explainer:
Genetic Science Learning Center: Genetics basics and proteinsYou've passed Unit 2, so the optional extra-credit track is open. Complete reserved-unit work from home, including virtual labs, for extra credit. Each item shows its correct submission route.
Open the extra-credit track- CompleteEvery required part of the artifact is present, nothing left blank.
- AccurateThe science and the data are correct and match the evidence.
- Scientific reasoningYou explain your claim with evidence and reasoning (CER), not just an answer.
- Professional communicationClear, organized, labeled, and written the way a clinician or scientist would.
- SubmittedTurned in the right way, on the class site or handed to Mr. Mendoza in class, and confirmed. Not in Schoology: that is where the report-card grade appears later.
- Error analysis and method · counts doubleName a specific limit of the method and how it moved your result, and compare what you predicted to what happened. "Human error" does not count; say what about the procedure or instrument caused it.