
SNP and PTC case
Open your materials, follow the steps, then turn in your work.
Connect a single-nucleotide polymorphism to a phenotype using the PTC-tasting genotype dataset.
1. Open your materials
Use the materials named in the first step below. Open lesson resources.
2. Start the work
Open the teacher genotype dataset in the shell and find the SNP column for the PTC-tasting gene.
Show all 5 required steps
- Open the teacher genotype dataset in the shell and find the SNP column for the PTC-tasting gene.
- For three people, write their genotype next to their phenotype and mark homozygous or heterozygous.
- Decide whether the tasting allele tracks with the trait and write one sentence of evidence.
- Predict the carrier status of one labeled person using allele language.
- Submit your genotype-to-phenotype table and prediction as your daily evidence.
Lost your place? Lost your place? If you have not located the SNP column for the PTC gene in the dataset yet, do that first (step 1). If you already have three people's genotype-to-phenotype rows, move to predicting one person's carrier status in allele language (step 4), then submit.
Check your work before submitting
- You'll be able to read a SNP genotype and pair it to a phenotype.
- You'll be able to predict carrier status from genotype data.
Before lab work: read the safety rules
- Wear the required PPE, keep the bench clear, handle equipment only as directed, and know where the eyewash, sink, and spill kit are before you start.
- Human samples and data stay private: label with a code, never a name, and dispose of materials in the correct waste container, then wash your hands.
3. Turn in your work
DueCheck Schoology- Hand in
- Genotype-to-phenotype table for three individuals (homozygous/heterozygous labeled) and a written carrier prediction.
How to submit and name your file
Use the submission route shown on today's page.
In Schoology, open your course and the assignment for this lesson. Attach your file, select Submit, and check that it appears in the submission.
PDF upload helpYou get two school days for every day you were absent, so this deadline moves with you.
Find this lesson's Schoology assignments
These are existing assignments for your section. Follow the directions in the assignment you are working on; this list does not add new work. Check Schoology for each deadline.
Link will not open? Open Schoology, choose your course and section, and find the title shown above.
How this lesson connects
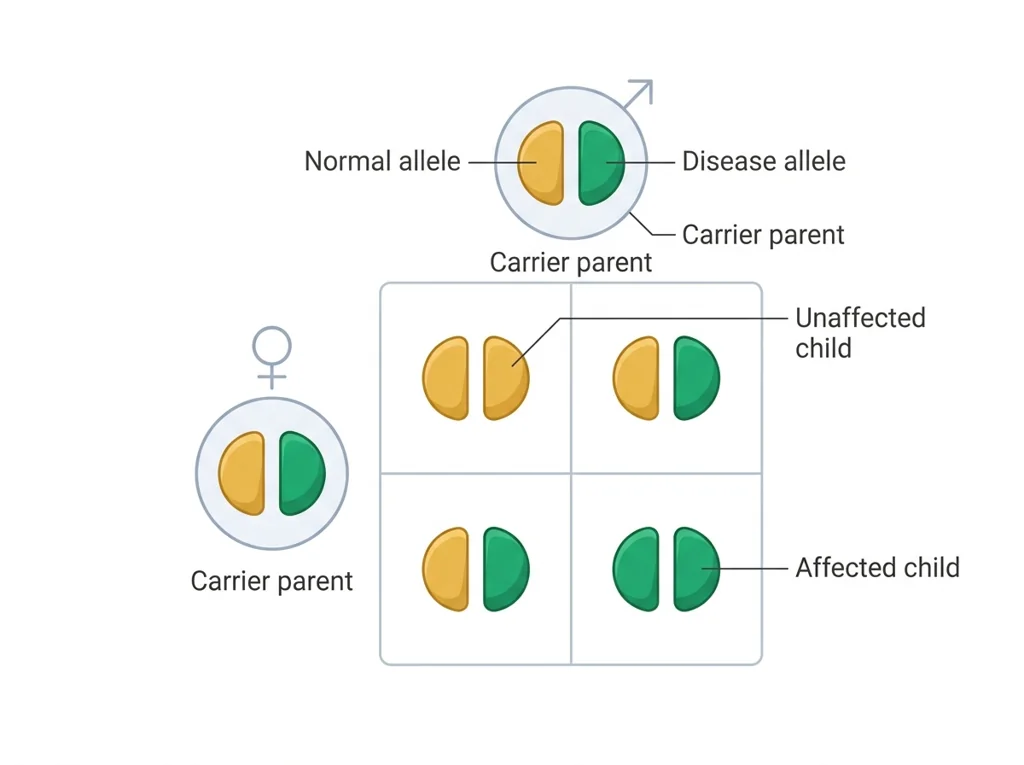
Keep using what you learned last class: Two unaffected parents can each carry a silent recessive allele, so an affected child appearing from healthy parents is strong evidence the trait is recessive, not a break in the family tree. Today: Three single-base differences in TAS2R38 are inherited together and change the shape of the bitter-taste receptor, so that haplotype is what decides whether PTC tastes bitter or like nothing at all.
Optional: listen or watch a unit review▸
Need help? Warm-up, timing, and directions▸
💡 Big idea: Three single-base differences in TAS2R38 are inherited together and change the shape of the bitter-taste , so that haplotype is what decides whether PTC tastes bitter or like nothing at all.
- 0-8Hook: PTC tasting demo or description; introduce SNP vocabulary
- 8-25Open dataset; locate SNP column; record and phenotype for three individuals
- 25-40Mark each as homozygous or heterozygous; decide if tasting tracks phenotype
- 40-55Write one evidence sentence; predict status for one labeled person
- 55-70Partner check: verify language and logic
- 70-80Submit table and prediction to the class site
- • Hook: Pass around PTC strips (if available) or describe the tasting phenotype; ask who tasted bitterness.
- • Why it matters: This same SNP-to-phenotype logic underlies pharmacogenomics, where a small number of base differences can change how a patient responds to a drug.
- • Today's work: You read a real dataset and connect alleles to phenotypes the same way a lab does.
- • Exit goal: -to-phenotype table and prediction submitted before the bell.
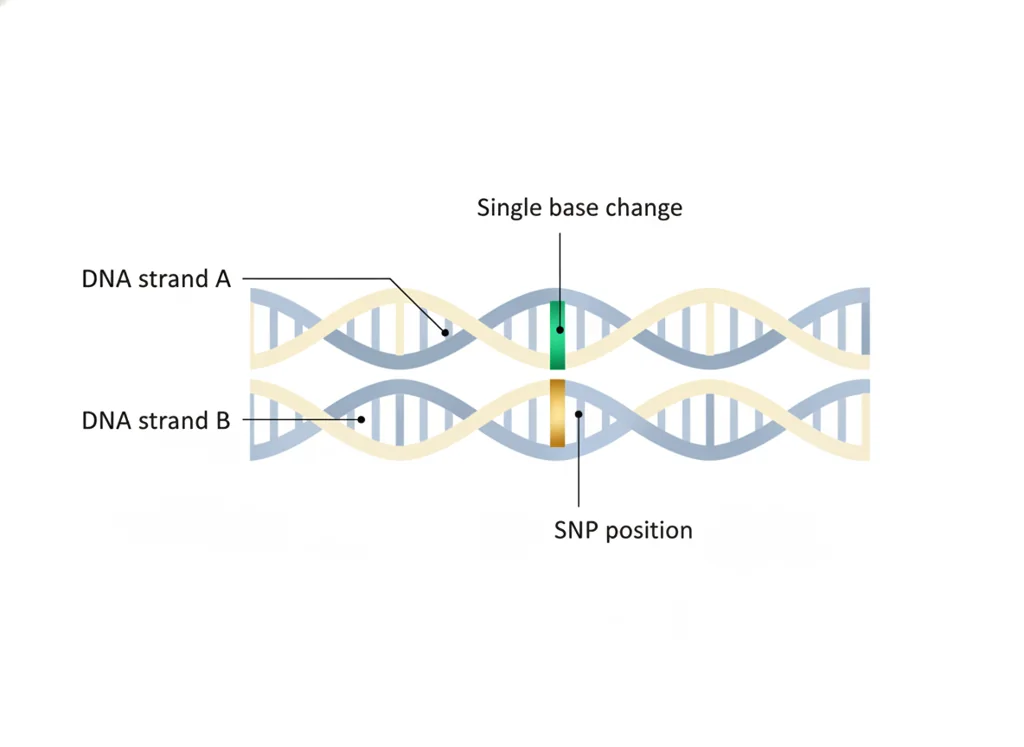
- • A SNP is a single base-pair variation at a specific ; millions exist across the human genome.
- • The TAS2R38 gene carries three common SNPs that are inherited together as a haplotype; the PAV combination gives the taster phenotype and AVI gives the non-taster.
- • Inheriting at least one PAV haplotype usually gives the taster phenotype; two AVI haplotypes usually give the non-taster. Usually, not always: other genes and age shift it.
PLTW connection and today's work
Open Activity 2.1.3 Test Your Own Genes in myPLTW and use the teacher genotype dataset to connect SNP alleles to phenotypes.
Today's stopping point: Pedigree should be done (Tuesday); SNP table and carrier prediction due today.
PLTW activity titles identify the course connection. If your account will not open, use the posted materials for today and tell Mr. Mendoza. Do not mark an online activity complete unless you completed it.
Course connection
- Activity 2.1.3 Test Your Own Genes
Use the turn-in directions at the top of this page. Do not create a second submission unless your teacher asks for one.
Show another explanation or a smaller first step
Need help? Choose a starting point
Finish the assigned lab safely before starting extra practice.
Lesson resources: reading, slides, and vocabulary▸
The deck carries the prior idea forward, lets you inspect an analogy, maps the rule to biology, and ends with the same evidence decision and exit ticket used on this page.
Generated from this lesson's canonical data with a red-team citation check.
Two unaffected parents can each carry a silent recessive , so an affected child appearing from healthy parents is strong evidence the trait is recessive, not a break in the family tree.
Three single-base differences in TAS2R38 are inherited together and change the shape of the bitter-taste , so that haplotype is what decides whether PTC tastes bitter or like nothing at all.
A library keeps a master plan protected while working copies guide production at different stations.
- Why protect the master copy?
- What information moves?
- Where can an error change the final product?
Stored information can be copied, read, and converted into a functional product.
Genes are regulated biological sequences, not conscious instructions, and one gene rarely determines a whole trait alone.
- • Master plan maps to DNA.
- • Working copy maps to RNA.
- • Production output maps to or a regulated cell function.
Driving question: In the TAS2R38 dataset, why do some people gag on a PTC test strip while others taste nothing at all, when the difference between them comes down to a single swapped nucleotide?
What you already know: Two unaffected parents can each carry a silent recessive , so an affected child appearing from healthy parents is strong evidence the trait is recessive, not a break in the family tree.
New idea: Three single-base differences in TAS2R38 are inherited together and change the shape of the bitter-taste , so that haplotype is what decides whether PTC tastes bitter or like nothing at all.
Visual or model: F1. F1. A lesson illustration or teaching diagram for SNP and PTC case. Use it with E1-E3; it is a model or context image, not experimental or patient data. What to notice: Trace the labeled testing, treatment, or biological process and identify where evidence limits the decision.
- Observe or measure the relevant feature in today's lesson.
- Organize the observation with a stable evidence ID.
- Apply this rule: Stored information can be copied, read, and converted into a functional product.
- Choose the option the evidence supports and state the limit of the conclusion.
Real biomedical example: In the TAS2R38 dataset, why do some people gag on a PTC test strip while others taste nothing at all, when the difference between them comes down to a single swapped nucleotide?
What the evidence supports: E1-E3 and F1 support the daily take-home when the response meets the stated success criteria.
What it cannot prove: The package does not support claims beyond this lesson's or any real patient diagnosis.
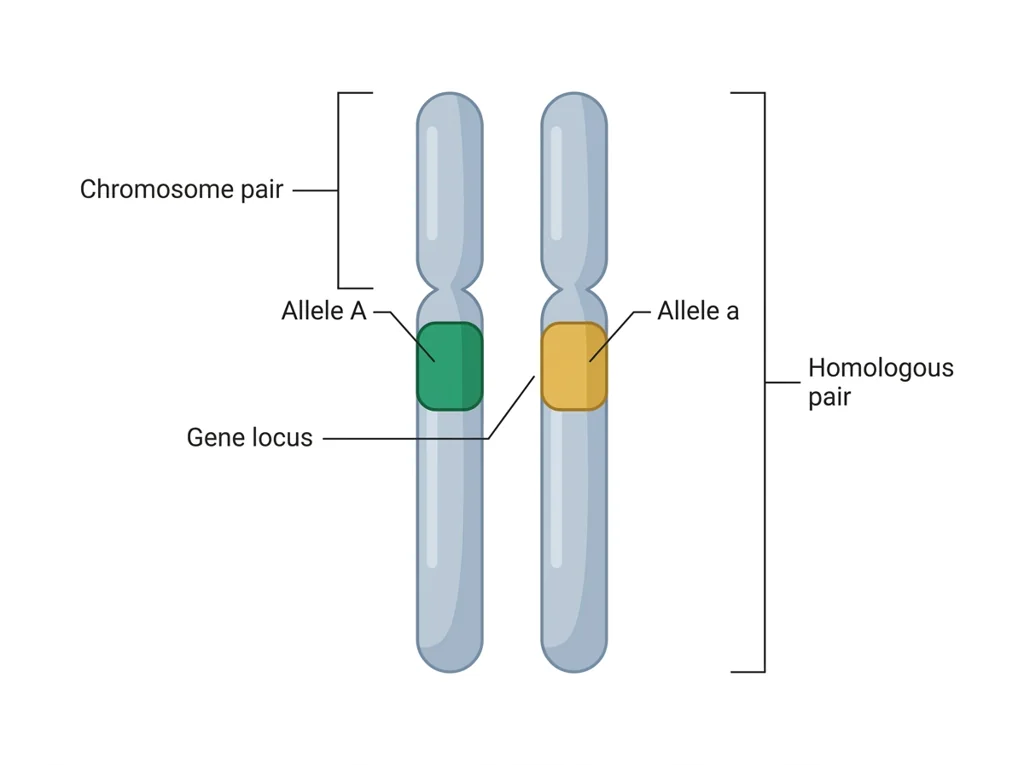
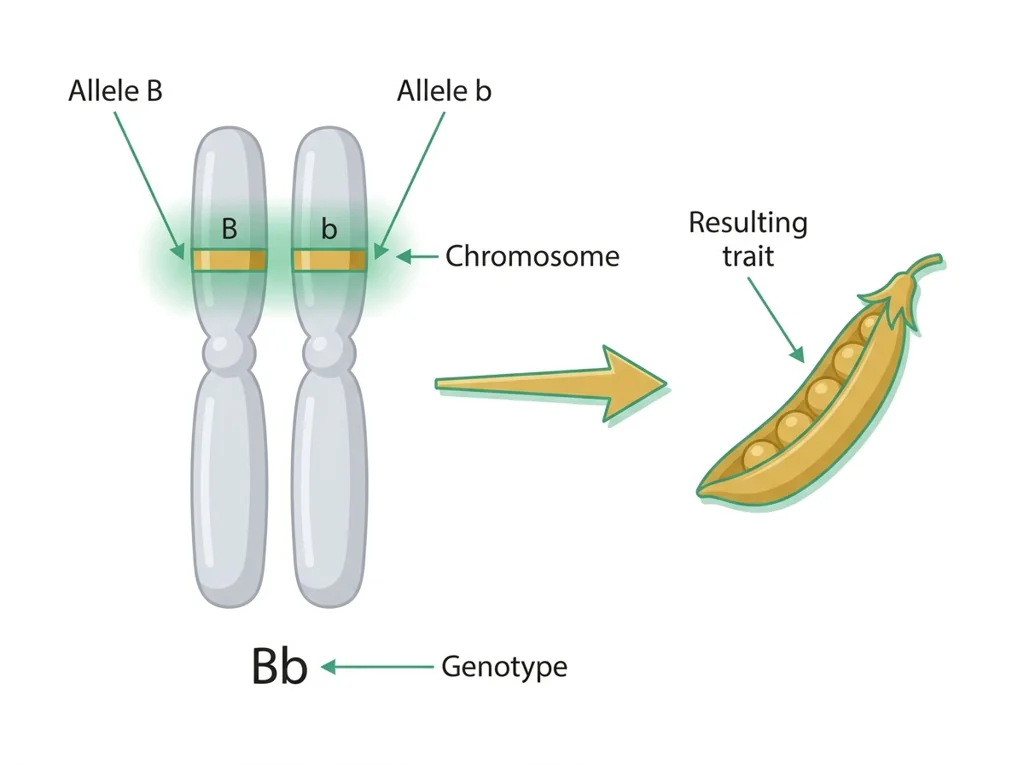
- • : One of the alternative versions of a gene found at the same spot on a , like the A, B, and O versions of the blood-group gene.
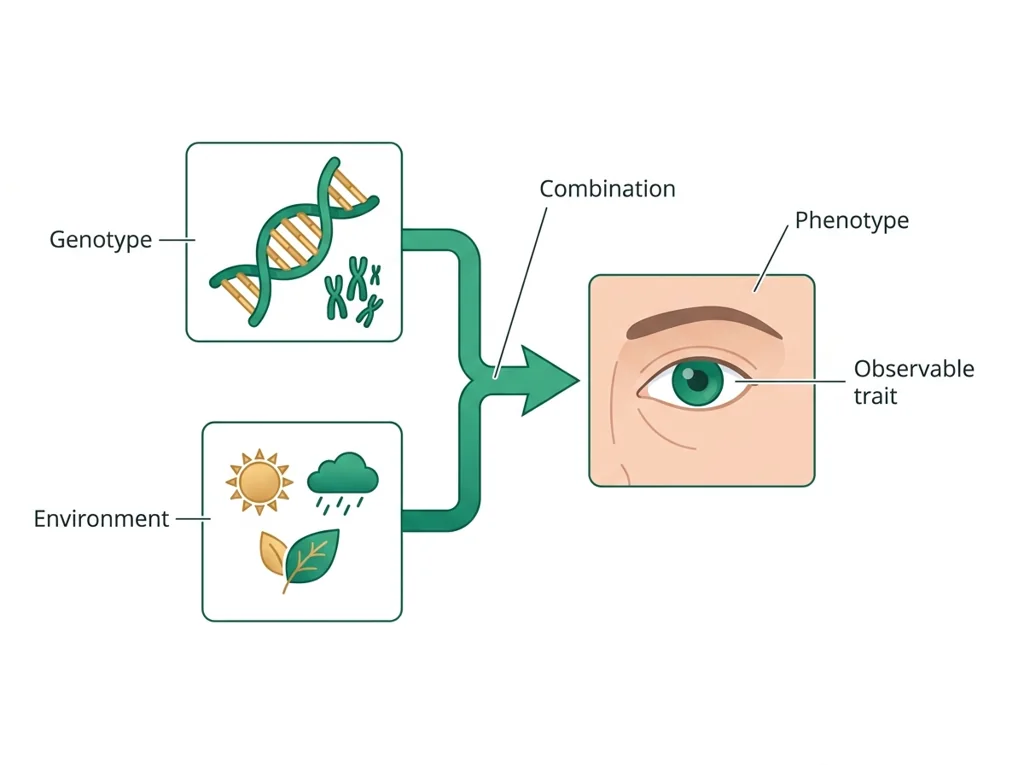
- • : The specific set of gene versions an individual carries, which works with the environment to shape observable traits.
- • phenotype: The observable traits of an organism, such as appearance or function, that result from its combined with environmental influences.
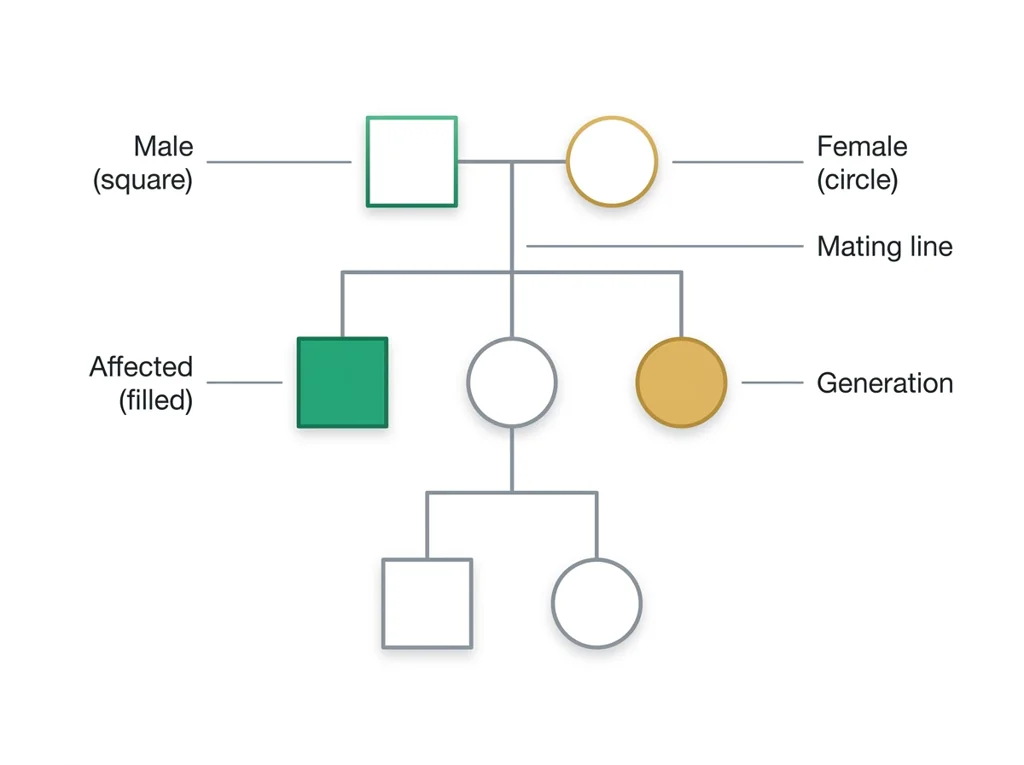
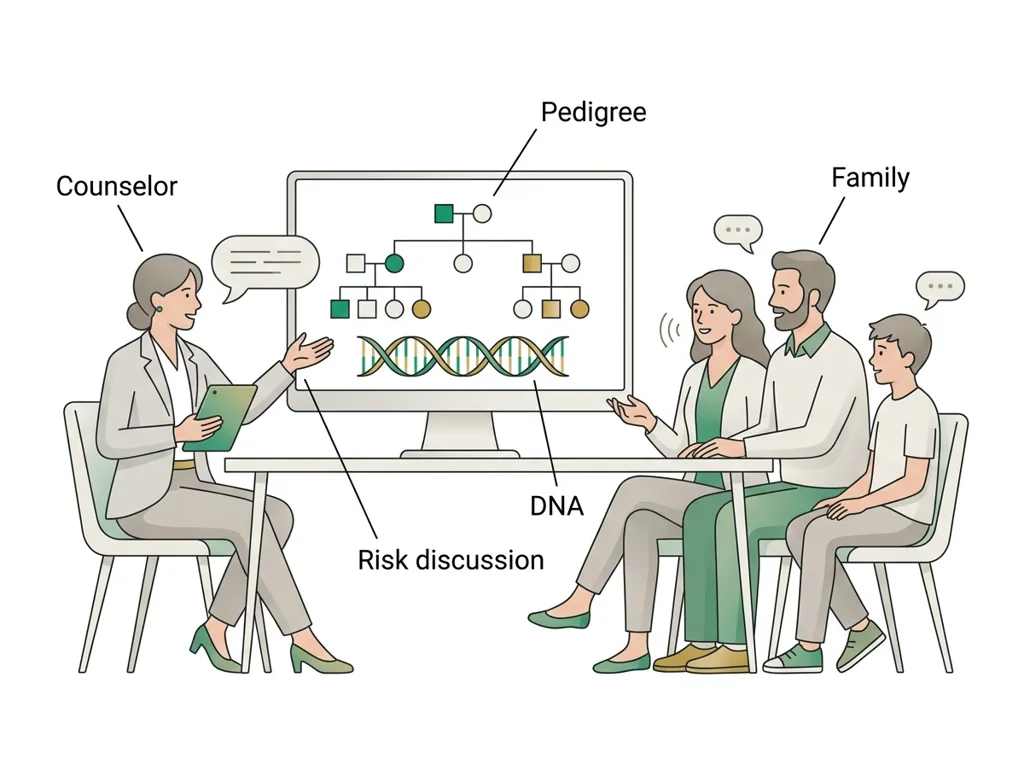
- • pedigree: A family tree drawn with standard symbols (squares for males, circles for females, filled for affected) so any geneticist can read a family at a glance.
- • SNP: A single-nucleotide polymorphism, a one-letter difference in DNA at a specific spot that varies between people.
- • : A person who carries one copy of a disease without showing symptoms but can pass it to their children.
- • : A guided conversation with a trained specialist who explains inherited disease risks, test options, and choices to help a family make informed decisions.
Use it now: Choose one decision option. Cite E1 and E3, then explain how the rule connects the evidence to your choice.
Go further, optional: The source links below are optional enrichment. Every fact required for today's local evidence decision appears in this lesson package.
Genetic evidence can support an inheritance, , sequence, or expression explanation, but penetrance, regulation, environment, family structure, and test uncertainty can limit the conclusion.
Limit: A classroom , , pedigree, or molecular model does not establish a real person's diagnosis, prognosis, identity, or reproductive outcome.
Stored information can be copied, read, and converted into a functional product.
Limit: Genes are regulated biological sequences, not conscious instructions, and one gene rarely determines a whole trait alone.
You can read a SNP and pair it to a phenotype.
Limit: E3 defines the classroom product or success criterion. It is not independent scientific evidence and cannot justify a clinical or causal claim.
PLTW-GEND-2026-10-19 · Simulated classroom evidence scenario
Your role: medical interventions team member
Decision: Your team must decide what the evidence from today's lesson supports before submitting the labeled and result claim named on today's page.
- • Conclude that non-tasters are missing the taste gene, since a difference you can feel needs a big DNA change.
- • Collect matching and taste results from a second, separate group before treating one letter as the whole story.
- • Explain the tasting difference as one swapped base in TAS2R38 that alters the bitter taste .
Response: State one choice, cite at least two evidence IDs, explain the rule that connects them, and add one limitation. Submit it as the labeled and result claim.
Claim ceiling: Today's evidence supports a classroom claim about today's lesson. It cannot prove causation, diagnose a real patient, or justify action outside this room.
Reason for review: Your team must decide what the evidence from today's lesson supports before submitting the labeled and result claim named on today's page.
Context: One base-pair change at the right spot can flip a phenotype, because a single nucleotide polymorphism can alter the a gene builds, and that is why individual DNA letters, not just whole genes, matter for who we are.
- • T1: Open the teacher dataset in the shell and find the SNP column for the PTC-tasting gene.
- • T2: For three people, write their next to their phenotype and mark homozygous or heterozygous.
- • T3: Decide whether the tasting tracks with the trait and write one sentence of evidence.
- • T4: Predict the status of one labeled person using language.
- • T5: Submit your -to-phenotype table and prediction as your daily evidence.
- • E1: Genetic evidence can support an inheritance, , sequence, or expression explanation, but penetrance, regulation, environment, family structure, and test uncertainty can limit the conclusion.
- • E2: Stored information can be copied, read, and converted into a functional product.
- • E3: You can read a SNP and pair it to a phenotype.
Measurements: No patient measurement is supplied unless it appears explicitly in E1-E3 or F1. Do not invent a value.
Figure finding: Teaching diagram for SNP and PTC case. Trace the labeled testing, treatment, or biological process and identify where evidence limits the decision. This is a teaching model, not patient or experimental data.
Uncertainty: This is a composite classroom scenario. Missing history, measurements, or confirmation tests remain unknown and limit the conclusion.
Students often think Students think a non-taster must have 'no gene' for tasting, or that the difference is a large deletion, because they assume big phenotype differences require big DNA differences.. The trap: Both tasters and non-tasters have the TAS2R38 gene. The difference is a single base-pair swap (a SNP), not a missing gene. Expecting a huge DNA change for a clear trait will make you misread the dataset, where the only difference between the two phenotypes is one letter.
I found the SNP column for the TAS2R38 PTC-tasting gene and matched each person's genotype to their tasting phenotype. I used T for the taster allele and t for the non-taster allele.
Does the tasting allele track with the trait? Yes. Everyone with at least one T allele tasted PTC, and the only non-taster was homozygous tt. Evidence: Person 1 (TT) and Person 2 (Tt) both tasted; Person 3 (tt) did not, so the T allele tracks with tasting and behaves as dominant.
Carrier prediction: Person 2 is a heterozygous taster (Tt). They show the taster phenotype but carry one non-taster allele, so they could pass the non-taster allele to a child.
| Person | Genotype | Zygosity | Phenotype |
|---|---|---|---|
| 1 | TT | homozygous | taster |
| 2 | Tt | heterozygous | taster |
| 3 | tt | homozygous | non-taster |
This model shows the level of evidence and organization needed to complete: Completes the SNP case analysis: a genotype-to-phenotype table for three individuals with homozygous or heterozygous labels, an evidence sentence, and a carrier prediction.
- Name the variables and include units.
- Enter observations without changing the raw values.
- Check labels, calculations, and patterns before interpreting the data.
Keep the structure. Replace the question, facts, measurements, and evidence. Then recheck units, vocabulary, and whether the conclusion goes beyond the evidence.
Also due today: Submit your genotype-to-phenotype table and prediction to Schoology.
- CER:
- Claim, Evidence, Reasoning: make a claim, back it with evidence, explain your reasoning.
- SOP:
- Standard Operating Procedure, the exact steps to follow (especially in a lab).
- Tracker:
- Your PLTW progress log where you record completed evidence.
- myPLTW:
- The PLTW course site where you do the online activities. Find it in Clever with your Microsoft sign-in, right next to Schoology.
Tap the speaker to hear a term. Add two of these to your notebook glossary with a definition and an example in your own words.
Pick just 2 or 3 words from today and make them yours: write what each one means in your own words, name the context clue or evidence that helped, then give one example from what you actually did in SNP and PTC case. Try your own words first; the glossary is there if you get stuck. This is voluntary and counts as extra credit, so keep it short.
Saved on this device. Show Mr. Mendoza or add these to your notebook glossary to claim the extra credit.
Play the cold open at the start of the unit to set the scene. Each recording is AI-generated and simulated (fictional callers, no real people or student data).
Classroom documents for this lesson are posted in Schoology. Open Clever, then Schoology, and find each one by the name shown on its card.
Use this after the required lesson work when you are ready for a harder application or a deeper connection.
Placement rationale
Matched Genetic testing, PTC, pedigree, SNPs by path:Medical-Interventions/Unit-2_How-to-Screen-Your-Genes/2.1_Genetic-Testing-and-Screening; keywords:genetic testing, screening, ptc. Score 150. Visibility: student-schoology (student-facing resource; link through Schoology rather than local path).
Use this as the classroom resource for Genetic testing, PTC, pedigree, SNPs.
Placement rationale
Matched Genetic testing, PTC, pedigree, SNPs by path:Medical-Interventions/Unit-2_How-to-Screen-Your-Genes/2.1_Genetic-Testing-and-Screening; keywords:genetic testing, screening, snp. Score 146. Visibility: student-schoology (student-facing resource; link through Schoology rather than local path).
Use this if you were absent, got stuck, or need another pass before you submit the lesson artifact.
Placement rationale
Matched Genetic testing, PTC, pedigree, SNPs by path:Medical-Interventions/Unit-2_How-to-Screen-Your-Genes/2.1_Genetic-Testing-and-Screening; keywords:genetic testing, screening. Score 142. Visibility: student-schoology (student-facing resource; link through Schoology rather than local path).
Sign in to Clever with your district Microsoft account to open Schoology or myPLTW. Follow today's posted steps. If myPLTW will not open, use the posted alternative and tell Mr. Mendoza. Turn in your completed work through the Schoology assignment.
Practice: try a question, then check your answer▸
Claim ceiling for this check: Today's evidence supports a classroom claim about today's lesson. It cannot prove causation, diagnose a real patient, or justify action outside this room.
A person's TAS2R38 genotype is heterozygous (one taster allele, one non-taster allele). Will they taste PTC, and are they a carrier of the non-taster allele?
Write an answer and pick a confidence to unlock the key.
Fast retrieval with instant answers, not the commit-then-reveal check above. Try each from memory first: write what you remember about the earlier units, then check yourself here.
Missed class or ready for more?▸
Run this before you touch the bench. It is built from the real lab procedure, so the decisions you make here are the ones you will make with the equipment in your hands.
I can name the procedure's purpose and the evidence I will record. I can state today's specific hazards and the control for each. If this deck does not name them, I ask Mr. Mendoza before I touch anything. My data table is ready before materials are handled.
Finish the checklist before you handle any material.
- • Wear the required PPE, keep the bench clear, handle equipment only as directed, and know where the eyewash, sink, and spill kit are before you start.
- • Human samples and data stay private: label with a code, never a name, and dispose of materials in the correct waste container, then wash your hands.
- 1Before materials are handled, identify the purpose, variables or comparison, controls, measurement units, and stop-work condition.
- 2Open the teacher genotype dataset in the shell and find the SNP column for the PTC-tasting gene.
- 3For three people, write their genotype next to their phenotype and mark homozygous or heterozygous.
- 4Decide whether the tasting allele tracks with the trait and write one sentence of evidence.
- 5Predict the carrier status of one labeled person using allele language.
- 6Submit your genotype-to-phenotype table and prediction as your daily evidence.
- 7Record each result in the prepared table before interpreting it. Mark missing, repeated, or invalid results truthfully.
- 8Complete the named cleanup and waste route, remove PPE safely, wash hands when required, and confirm the station is ready for the next group.
| Trial or sample ID | Independent condition | Measured result with units | Observation before interpretation | Quality-control note |
|---|---|---|---|---|
Before the procedure, predict the result and cite the rule behind the prediction.
After the procedure, compare the result with the prediction and name one limitation or source of uncertainty.
What today's skills lead to. These are real health-science careers this course builds toward. Tap one to see, on the US Department of Labor's O*NET site, what the job actually involves, what it pays, and how fast it is growing.
From home, use the provided teacher dataset to complete the same case: build the genotype-to-phenotype table for three people and predict one person's status with a written explanation.
Teacher genotype dataset (PLTW course shell)Use the submission route shown on today's page.
Class still runs. Complete the online activity above (it's self-guided). Need the concept taught without a teacher? Use this authoritative explainer:
MedlinePlus: What is genetic testing?- CompleteEvery required part of the artifact is present, nothing left blank.
- AccurateThe science and the data are correct and match the evidence.
- Scientific reasoningYou explain your claim with evidence and reasoning (CER), not just an answer.
- Professional communicationClear, organized, labeled, and written the way a clinician or scientist would.
- SubmittedGo to Schoology to turn this in. Submit one PDF. Put your first and last name in the document header. Name the file: FirstName LastName - Assignment Title - YYYY-MM-DD.pdf. If you cannot get in, see Mr. Mendoza. Do not skip the work.
- Error analysis and method · counts doubleName a specific limit of the method and how it moved your result, and compare what you predicted to what happened. "Human error" does not count; say what about the procedure or instrument caused it.
This week
My Progress dashboard