
This class runs in two periods and they do not do the same lesson on the same day. You are reading the Period 6A-7B calendar, the one with John Carroll bioethics on Mondays.

Source and agent CER
Do now
Students write a CER identifying the likely source and infectious agent of the outbreak.
- Hand in
- CER naming the likely outbreak source and infectious agent, citing epidemic curve, spot map, and agent-ID evidence, including an attack rate or incidence value, and stating assumptions and limitations.
- Where
- Submit this on the class form named on this page. The form requires the student's district Microsoft sign-in. The thank-you page is the submission receipt. A physical handoff counts only when the day page names that route. Doing the activity in myPLTW does not count as submitted.
You get two school days for every day you were absent, so this deadline moves with you.
If the form offers you a saved draft, choose New draft. If the Assignment box comes up empty, type it exactly: Source and agent CER
Can you write a claim naming the reunion outbreak's source and agent that survives scrutiny because the curve, the map, and the test result each point to it on their own?
Students write a CER identifying the likely source and infectious agent of the outbreak.
- • Write a CER naming source and agent with multi-tool evidence.
- • Include a quantitative measure and at least one limitation.
- Write the attack-rate formula and calculate it for 12 cases among 40 exposed.
- Why is a claim backed by three different kinds of evidence stronger than the same claim repeated three times?
- 1State a claim naming the likely source and agent of the outbreak.
- 2Cite epidemic-curve, map, and identification-test evidence.
- 3Explain reasoning that links exposure patterns to the proposed source.
- 4Quantify the outbreak using incidence and attack-rate values.
- 5Identify assumptions and limitations in the data and methods.
What did this day actually feel like?
Source and agent CER
A CER naming the likely source and agent, citing three independent sources of evidence: curve shape, geographic cluster, and the identification test.
Three independent lines converging is what earns the claim. This is the same convergent-evidence idea from the week six ethics debate, showing up nine weeks later as a working method. I do not think that ordering is an accident.
AT HOME, THE NIGHT BEFORE FRI NOV 20 Submit tracker and evidence Curve, map, test results, and CER into one file, checked against the rubric, sources cited, limitations noted.
My confidence rating went up this week and it is the first time it has been honest rather than optimistic.
Turned in: full outbreak package → recorded in Class Records
Fiction. There is no such student. The lessons, labs and dates are the real planned course; the student, the classmates and the conversations are invented.
The same day, drawn.
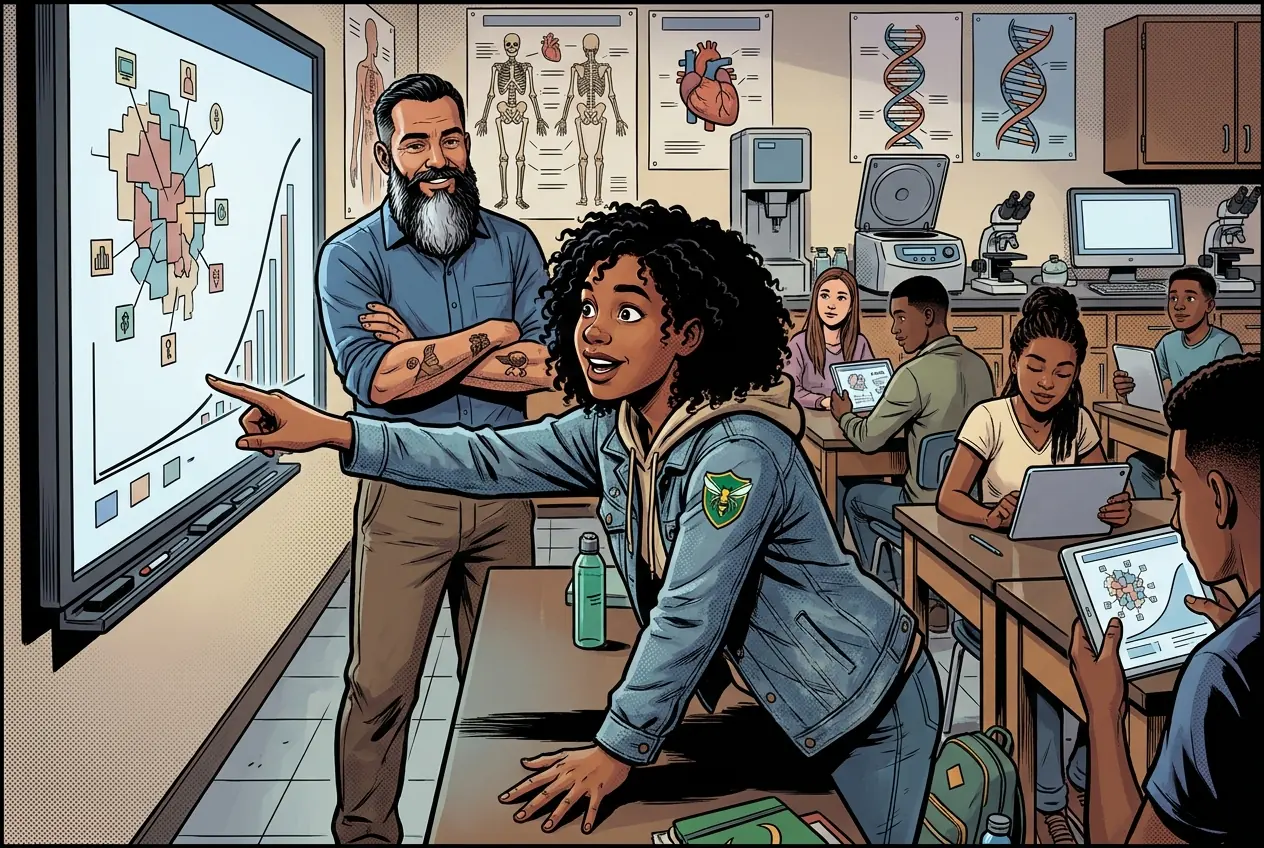
Three independent lines converging is what earns the claim. Same idea as the week six debate, arriving nine weeks later as a working method.
Fiction. There is no such student. The lessons, labs and dates are the real planned course; the student, the classmates and the conversations are invented.
🛠 Get unstuck · pick your level
🔑 Today's words · 5
Tap a word in the lesson for a plain meaning and one example. Recycled into next week's Do-Now.
🧭 Everything on this day
Check you have the right sheet: the top of it prints today's portal day, Source and agent CER. The PLTW activity itself is in myPLTW and is not posted here.
Do the work · 80-minute blockfirst 5 min = hook▸
💡 Big idea: A curve, a map, and an agent-ID test each measure something the others cannot, so an outbreak claim is trustworthy only because three independent lines of evidence agree on the same source.
- 0-8 minReview Wednesday data: confirm curve shape, map cluster location, and agent-ID result.
- 8-20 minWrite the claim: name the likely source (location/event) and infectious agent in one sentence.
- 20-45 minWrite evidence: cite curve shape, map cluster, and agent-ID result as three separate points.
- 45-60 minWrite reasoning: connect exposure patterns to the proposed source for each evidence point.
- 60-70 minCalculate and insert incidence or attack-rate value; add assumptions and limitations.
- 70-80 min: confirm three evidence sources are cited, quantitative value is present, limitation stated.
- • You have the curve, the map, and the agent-ID results from Wednesday: today you build the argument.
- • Every piece of evidence must be cited by the tool that produced it, not just described generically.
- • The quantitative section is mandatory: an attack rate or incidence value turns a description into a measure.
- • Your limitation should point to one specific gap in the Wednesday data that could change your conclusion.
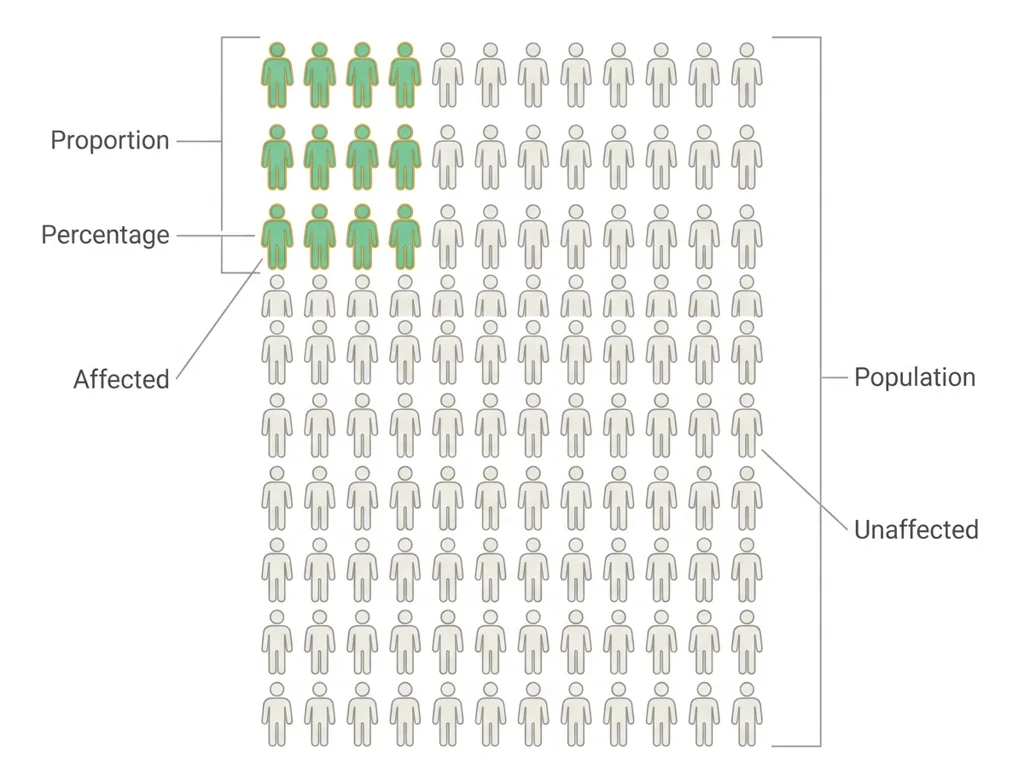
- • Attack rate = (number of cases / number exposed) x 100: a quantitative measure of outbreak severity.
- • Multi-tool evidence means citing the curve, the map, and the test result independently, not as a single statement.
- • Assumptions reveal where the investigation could be wrong; limitations reveal where the data is incomplete.
Unit 3.1 Outbreak Evidence: Line lists, maps, epidemic curves, infectious-agent identification lab or simulation. · Source and agent CER
Day 2 of this lesson. Open this exact section in myPLTW (find it in Clever, Microsoft sign-in), then do the work below.
Do this: In myPLTW, open Lesson 3.1 Nosocomial Nightmare and go to Activity 3.1.6 Gram Staining. Use it as the scaffold for your source-identification CER.
Mark Activity 3.1.6 Gram Staining complete in myPLTW before you start the independent CER.
Platform prompts done in first 15 minutes; full CER submitted before end of period.
Submitted CER on the class site, or hand it to Mr. Mendoza in class is the primary evidence.
The official PLTW activity stays inside myPLTW. If myPLTW will not open, use F1 and E1-E3 on this page to complete today's local evidence decision, then make up the official activity when access returns. Submit this on the class form named on this page. The form requires the student's district Microsoft sign-in. The thank-you page is the submission receipt. A physical handoff counts only when the day page names that route. Doing the activity in myPLTW does not count as submitted.
Check things off as you work, then submit. This tells Mr. Mendoza how you're doing so he can help the class. It does not replace turning in your producible through the submission route shown below.
Use the code Mr. Mendoza gave you, not your name. Saved on this device.
Unit 3.1 Outbreak Evidence: Line lists, maps, epidemic curves, infectious-agent identification lab or simulation. · Source and agent CER
In myPLTW, open Lesson 3.1 Nosocomial Nightmare and go to Activity 3.1.6 Gram Staining. Use it as the scaffold for your source-identification CER.
Platform prompts done in first 15 minutes; full CER submitted before end of period.
This is how Mr. Mendoza sees the class keeping pace with PLTW. Be honest, it only helps if it is accurate.
🎯 Students write a CER identifying the likely source and infectious agent of the outbreak.
- State a claim naming the likely source and agent of the outbreak.
- Cite epidemic-curve, map, and identification-test evidence.
- Explain reasoning that links exposure patterns to the proposed source.
- Quantify the outbreak using incidence and attack-rate values.
- Identify assumptions and limitations in the data and methods.
CER: CER naming the likely outbreak source and infectious agent, citing , spot map, and agent-ID evidence, including an attack rate or incidence value, and stating assumptions and limitations.
Submit this on the class form named on this page. The form requires the student's district Microsoft sign-in. The thank-you page is the submission receipt. A physical handoff counts only when the day page names that route. Doing the activity in myPLTW does not count as submitted. Use the checklist just below and upload by 11:29 PM for full credit. Absent with an excused absence? You get two school days for every day you were absent, so this deadline moves with you.
| Task | Who |
|---|---|
| State a claim naming the likely source and agent of the outbreak. | _______ |
| Cite epidemic-curve, map, and identification-test evidence. | _______ |
| Explain reasoning that links exposure patterns to the proposed source. | _______ |
| Quantify the outbreak using incidence and attack-rate values. | _______ |
| Identify assumptions and limitations in the data and methods. | _______ |
Working solo? Put your own name in "Who" for every row.
- Write a CER naming source and agent with multi-tool evidence.
- Include a quantitative measure and at least one limitation.
- 1Do thisStudents write a CER identifying the likely source and infectious agent of the outbreak.
- 2Use this resource
- 3Submit thisCER: CER naming the likely outbreak source and infectious agent, citing epidemic curve, spot map, and agent-ID evidence, including an attack rate or incidence value, and stating assumptions and limitations.
- 4Submit it here
- 1Open the form. It must say For students at the top: if it says For parents and guardians, press Back and pick I am the student.
- 2If it offers you a saved draft, choose New draft: an old draft brings back the old assignment.
- 3Sign in with your district Microsoft account, not a personal one.
- 4Check the Assignment box says today's assignment from this page, then pick your period and type your student ID, all nine digits.
- 5Attach your file and press Submit. The thank-you page is your receipt.
Submit this on the class form named on this page. The form requires the student's district Microsoft sign-in. The thank-you page is the submission receipt. A physical handoff counts only when the day page names that route. Doing the activity in myPLTW does not count as submitted. Principles of Biomedical Technology (Principles of Biomedical Science) › Unit 3.1 Outbreak Evidence: Line lists, maps, epidemic curves, infectious-agent identification lab or simulation. › CERTurn it in
Learn it · deck, reading, and vocabulary▸
The deck carries the prior idea forward, lets you inspect an analogy, maps the rule to biology, and ends with the same evidence decision and exit ticket used on this page.
Generated from this lesson's canonical data with a red-team citation check.
Each identification test reads only one property of a , so narrowing to the true agent works by stacking several test results together to eliminate suspects, not by finding one test that names it.
A curve, a map, and an agent-ID test each measure something the others cannot, so an outbreak claim is trustworthy only because three independent lines of evidence agree on the same source.
Wet footprints appear across connected rooms after one person enters from the rain.
- Which footprint came first?
- Which rooms connect?
- What pattern would support more than one entry point?
Patterns across time and connection can narrow a explanation without proving it by themselves.
People change behavior, infections have periods, and surveillance data can be incomplete.
- • Footprints map to recorded cases.
- • Room connections map to exposures.
- • The route hypothesis maps to a limited claim.
Driving question: Can you write a claim naming the reunion outbreak's source and agent that survives scrutiny because the curve, the map, and the test result each point to it on their own?
What you already know: Each identification test reads only one property of a , so narrowing to the true agent works by stacking several test results together to eliminate suspects, not by finding one test that names it.
New idea: A curve, a map, and an agent-ID test each measure something the others cannot, so an outbreak claim is trustworthy only because three independent lines of evidence agree on the same source.
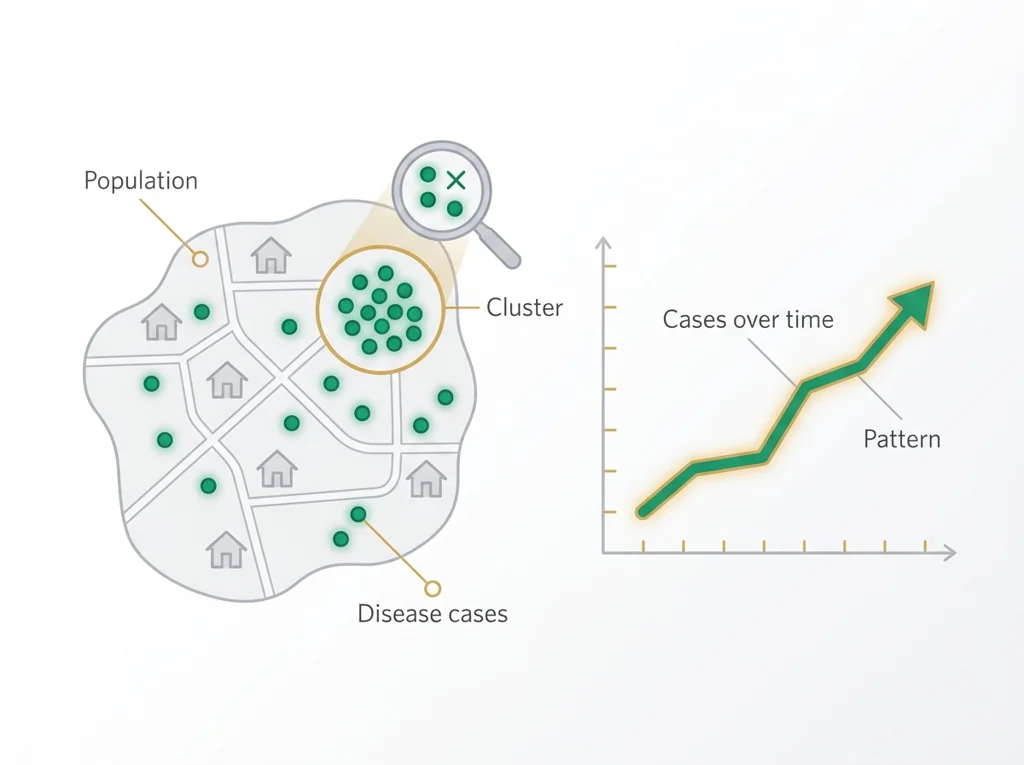
Visual or model: F1. F1. A lesson illustration or teaching diagram for Source and agent CER. Use it with E1-E3; it is a model or context image, not experimental or patient data. What to notice: Use the labels and arrows in F1 to identify the relationship that supports Source and agent CER.
- Observe or measure the relevant feature in today's lesson.
- Organize the observation with a stable evidence ID.
- Apply this rule: Patterns across time and connection can narrow a explanation without proving it by themselves.
- Choose the option the evidence supports and state the limit of the conclusion.
Real biomedical example: Can you write a claim naming the reunion outbreak's source and agent that survives scrutiny because the curve, the map, and the test result each point to it on their own?
What the evidence supports: E1-E3 and F1 support the daily take-home when the response meets the stated success criteria.
What it cannot prove: The package does not support claims beyond this lesson's or any real patient diagnosis.
- • epidemiology: The study of how diseases spread, who they affect, and what causes them across populations, used to find patterns and guide prevention.
- • : A table used in outbreak investigations where each row records one patient's key details, such as symptoms, dates, and exposures.
- • : A bar graph showing the number of new disease cases over time, used to track how fast an outbreak is growing or shrinking.
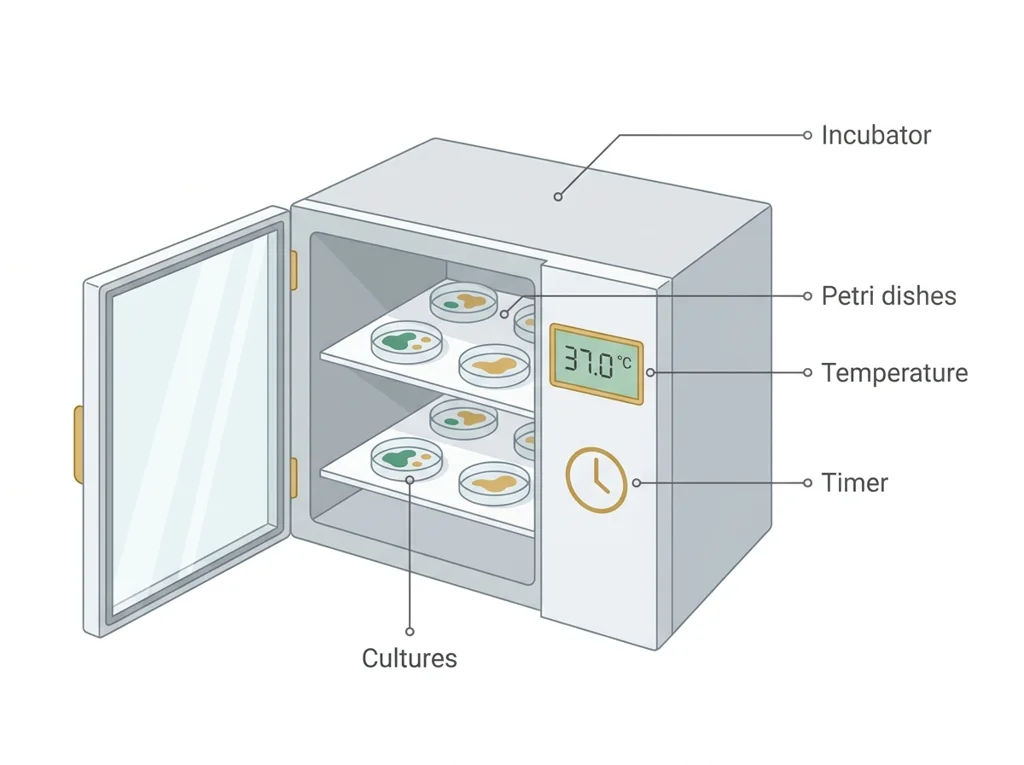
- • : Keeping samples or cultures at a controlled warm temperature for a set time so cells, microbes, or reactions can grow or proceed.
- • prevalence: The share of a population that has a particular disease or condition at a given time, often shown as a percentage.
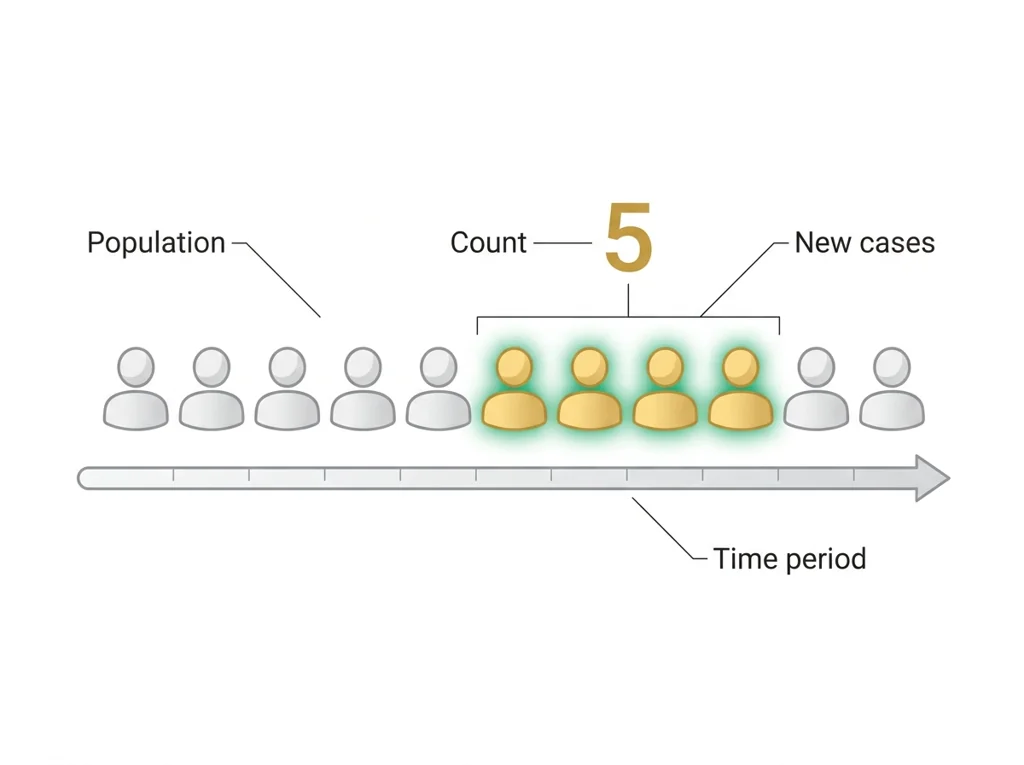
- • incidence: The number of new cases of a disease that appear in a population during a set period of time.
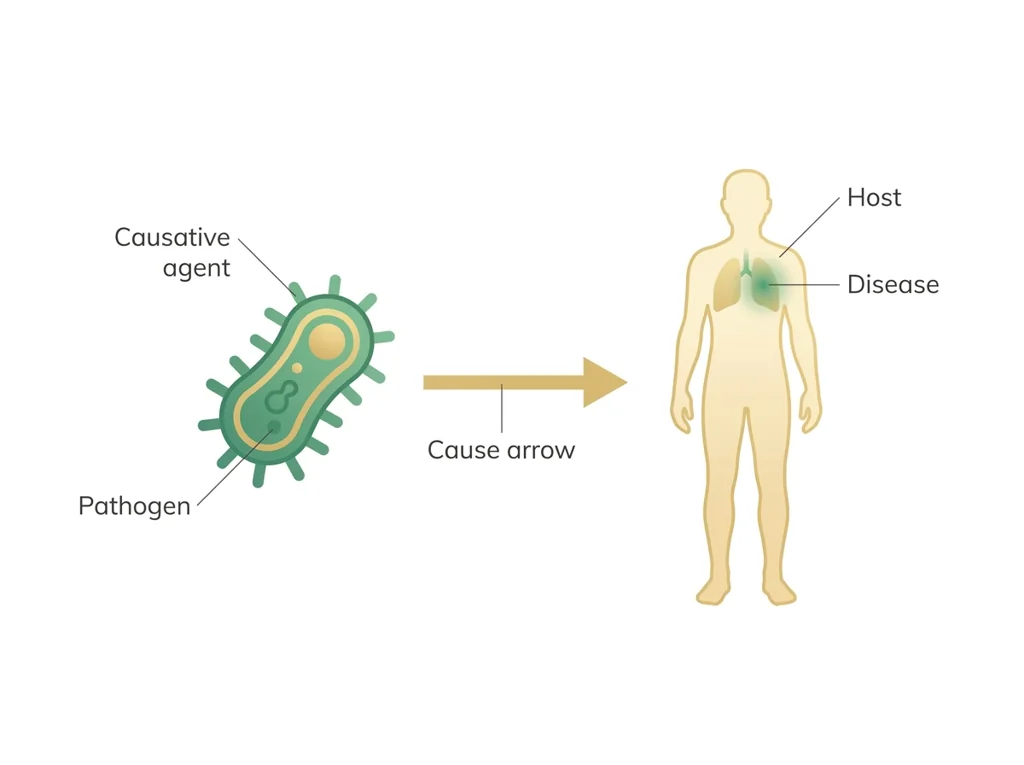
- • : The specific organism or factor, such as a bacterium, virus, or , that directly produces a particular disease.
Use it now: Choose one decision option. Cite E1 and E3, then explain how the rule connects the evidence to your choice.
Go further, optional: The source links below are optional enrichment. Every fact required for today's local evidence decision appears in this lesson package.
Patterns across person, place, and time can narrow an outbreak hypothesis, but they require case definitions, comparison data, and laboratory or epidemiological confirmation before a source is established.
Limit: A classroom map or curve can support a limited hypothesis and next investigation step, not a confirmed source or individual diagnosis.
Patterns across time and connection can narrow a explanation without proving it by themselves.
Limit: People change behavior, infections have periods, and surveillance data can be incomplete.
Write a CER naming source and agent with multi-tool evidence.
Limit: E3 defines the classroom product or success criterion. It is not independent scientific evidence and cannot justify a clinical or causal claim.
PLTW-PBT@P67-2026-11-19 · Simulated classroom evidence scenario
Your role: biomedical team member
Decision: Your team must decide what the evidence from today's lesson supports before submitting the claim-evidence-reasoning response named on the lesson page.
- • Choose the strongest supported explanation.
- • Choose the next evidence to collect.
- • Hold the decision because the evidence is insufficient.
Response: State one choice, cite at least two evidence IDs, explain the rule that connects them, and add one limitation. Submit it as the claim-evidence-reasoning response.
Claim ceiling: Today's evidence supports a classroom claim about today's lesson. It cannot prove causation, diagnose a real patient, or justify action outside this room.
Reason for review: Your team must decide what the evidence from today's lesson supports before submitting the claim-evidence-reasoning response named on the lesson page.
Context: A strong outbreak claim earns trust by triangulation: the same source is pointed to independently by the timing (curve), the geography (map), and the biology (agent ID), and a claim standing on only one of these is weak no matter how confident it sounds.
- • T1: State a claim naming the likely source and agent of the outbreak.
- • T2: Cite epidemic-curve, map, and identification-test evidence.
- • T3: Explain reasoning that links exposure patterns to the proposed source.
- • T4: Quantify the outbreak using incidence and attack-rate values.
- • T5: Identify assumptions and limitations in the data and methods.
- • E1: Patterns across person, place, and time can narrow an outbreak hypothesis, but they require case definitions, comparison data, and laboratory or epidemiological confirmation before a source is established.
- • E2: Patterns across time and connection can narrow a explanation without proving it by themselves.
- • E3: Write a CER naming source and agent with multi-tool evidence.
Measurements: Use only the measurements, units, graph, or counts supplied in today's task. No additional patient measurement is implied.
Figure finding: Teaching diagram for Source and agent CER. Use the labels and arrows to identify the decision-relevant relationship. This is a teaching model, not patient or experimental data.
Uncertainty: This is a composite classroom scenario. Missing history, measurements, or confirmation tests remain unknown and limit the conclusion.
Mean = sum of values / number of values. Median = middle ordered value. Range = maximum - minimum.
For 2, 4, 4, and 10: mean = 20 / 4 = 5, median = 4, and range = 10 - 2 = 8.
Mean, median, and range keep the measurement unit. Order the values before finding the median.
Calculate the requested summary for today's supplied values, then write what it reveals and what it hides.
Students often think Students think citing evidence means restating their conclusion a few times in different words, so 'the curve, map, and test all show it was the potato salad' reads to them like three pieces of evidence.. The trap: That is one claim stated three times, not three pieces of evidence, because real triangulation means each source contributes something the others cannot (the curve gives timing, the map gives location, the test gives biology), and only when three independent lines agree does the claim actually get stronger.
This is a MODEL from a different case, not the answer to today's reunion outbreak. Study how the pieces fit together, then build your own argument from your own curve, map, and test.\n\nScenario (parallel case): Campers at a lakeside summer camp fall ill with watery diarrhea over one week. Investigators have an epidemic curve, a spot map of cases by cabin, and a water sample result. They must name a likely source and agent.\n\nClaim: The likely source of the outbreak was untreated water from the camp's shallow well, and the likely agent was a waterborne protozoan parasite (Giardia).\n\nEvidence (three independent sources):\n- Epidemic curve: cases rose gradually and stayed elevated for about a week, a continuous-source pattern rather than one sharp peak.\n- Spot map: cases were spread across cabins on the well-fed side of camp, not clustered around any single meal or event.\n- Agent ID: a water sample from the well tested positive for Giardia cysts, a parasite spread through contaminated water.\n\nQuantitative measure: Attack rate = (24 cases / 80 campers using the well) x 100 = 30 percent.\n\nReasoning: A continuous-source curve means people kept getting exposed over days rather than all at once, which fits ongoing use of a water supply instead of one shared meal. The map locates the exposure with the campers who drank from the well, and the water test names the organism. Each tool answers a different question (when, where, what), and only together do they point to one explanation. A single peak would have suggested a one-time source, so the shape of the curve matters as much as the map and the test.\n\nAssumptions and limitations: I assume the count of 80 well users is accurate; if some listed campers actually drank bottled water, the true attack rate is higher. Onset dates were partly self-reported, so the curve's start could shift by a day. The positive sample shows the parasite was present in the water, but it does not prove every case drank from that well, so matching individual cases to well use would strengthen the claim.
This model shows the level of evidence and organization needed to complete: Parallel worked CER (different scenario) modeling the outbreak source-and-agent format: a claim naming a likely source and agent, three independent evidence sources (curve, map, test), a quantitative measure, reasoning that ties the tools together, and stated limitations.
- Write one defensible claim.
- Choose specific evidence that supports the claim.
- Explain the scientific rule that connects the evidence to the claim.
Keep the structure. Replace the question, facts, measurements, and evidence. Then recheck units, vocabulary, and whether the conclusion goes beyond the evidence.
Also due today: Submit your CER on the class site, or hand it to Mr. Mendoza in class before the end of the period.
- CER:
- Claim, Evidence, Reasoning: make a claim, back it with evidence, explain your reasoning.
- SOP:
- Standard Operating Procedure, the exact steps to follow (especially in a lab).
- Tracker:
- Your PLTW progress log where you record completed evidence.
- myPLTW:
- The PLTW course site where you do the online activities. Find it in Clever with your Microsoft sign-in, right next to Schoology.
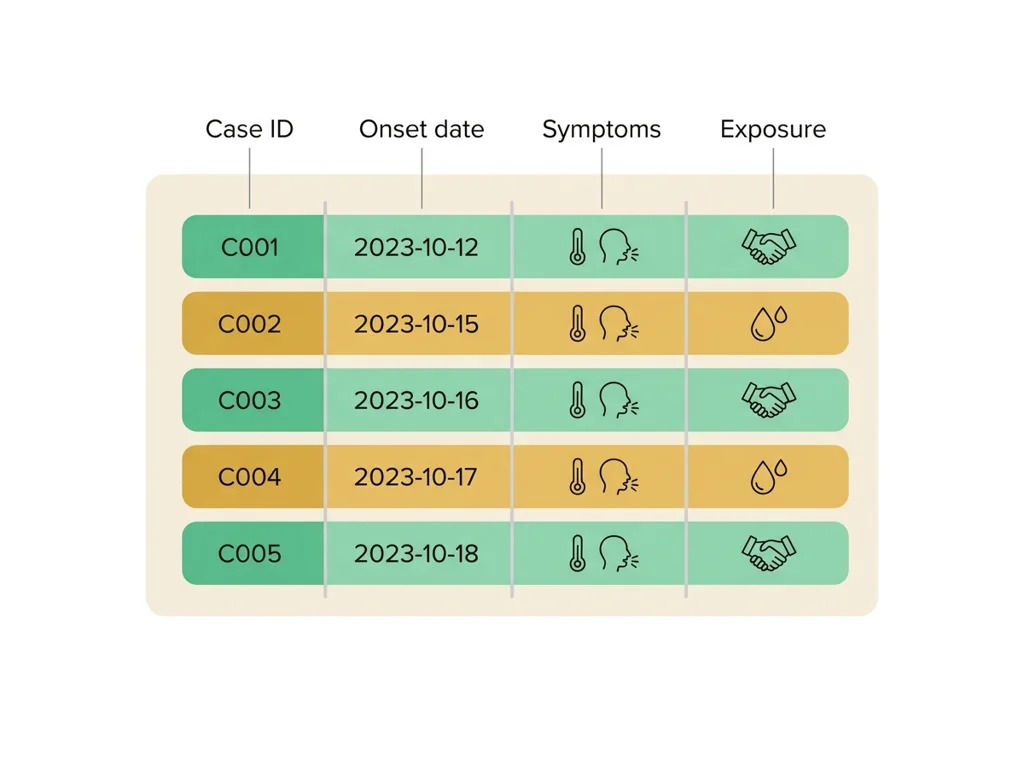
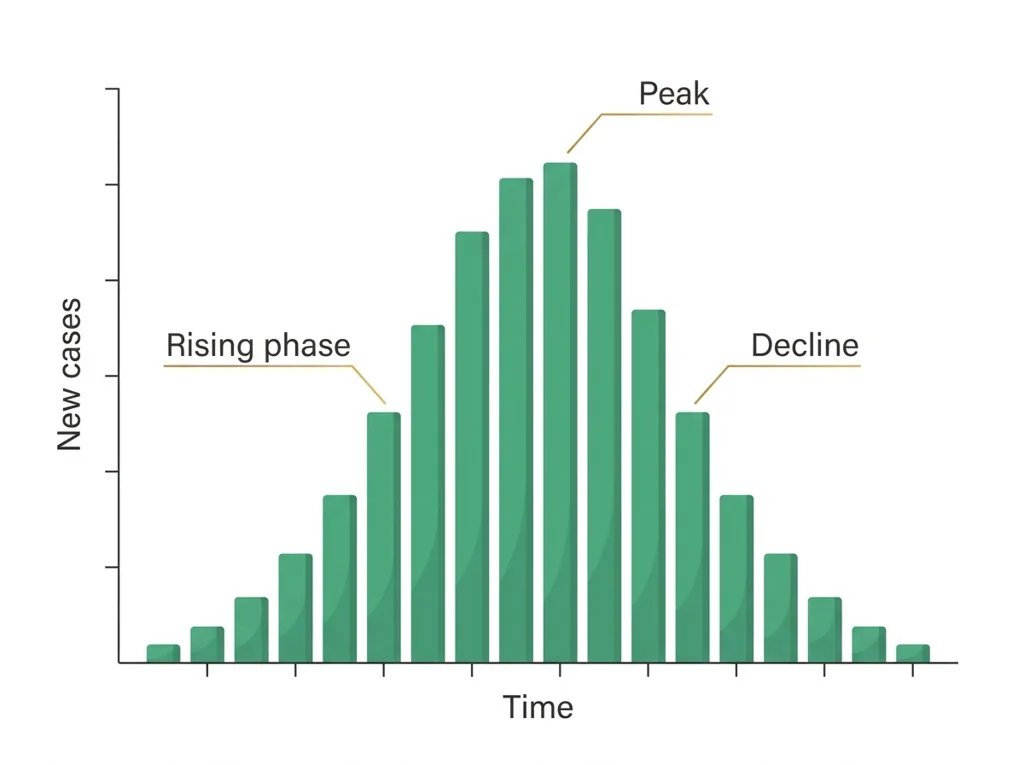
Tap the speaker to hear a term. Add two of these to your notebook glossary with a definition and an example in your own words.
Pick just 2 or 3 words from today and make them yours: write what each one means in your own words, name the context clue or evidence that helped, then give one example from what you actually did in Source and agent CER. Try your own words first; the glossary is there if you get stuck. This is voluntary and counts as extra credit, so keep it short.
Saved on this device. Show Mr. Mendoza or add these to your notebook glossary to claim the extra credit.
Hand-picked readings and interactives for this lesson, from authoritative open organizations and PLTW's own public course outline.
Check yourself · commit, then reveal▸
Claim ceiling for this check: Today's evidence supports a classroom claim about today's lesson. It cannot prove causation, diagnose a real patient, or justify action outside this room.
A student writes: 'The source was the potato salad. Evidence: the curve shows potato salad, the map shows potato salad, the test shows potato salad.' What is wrong with this as multi-tool evidence, and how should each line actually read?
Write an answer and pick a confidence to unlock the key.
Fast retrieval with instant answers, not the commit-then-reveal check above. Try each from memory first: write what you remember about the earlier units, then check yourself here.
Go further and get help▸
Run this before you touch the bench. It is built from the real lab procedure, so the decisions you make here are the ones you will make with the equipment in your hands.
What today's skills lead to. These are real health-science careers this course builds toward. Tap one to see, on the US Department of Labor's O*NET site, what the job actually involves, what it pays, and how fast it is growing.
Today is individual work you can do from home: complete the same target above, then submit your CER.
Turn it inSubmit this on the class form named on this page. The form requires the student's district Microsoft sign-in. The thank-you page is the submission receipt. A physical handoff counts only when the day page names that route. Doing the activity in myPLTW does not count as submitted.
Class still runs. Complete the online activity above (it's self-guided). Need the concept taught without a teacher? Use this authoritative explainer:
CDC: principles of epidemiology and outbreak investigationYou've passed Unit 2, so the optional extra-credit track is open. Complete reserved-unit work from home, including virtual labs, for extra credit. Each item shows its correct submission route.
Open the extra-credit track- CompleteEvery required part of the artifact is present, nothing left blank.
- AccurateThe science and the data are correct and match the evidence.
- Scientific reasoningYou explain your claim with evidence and reasoning (CER), not just an answer.
- Professional communicationClear, organized, labeled, and written the way a clinician or scientist would.
- SubmittedTurned in through the one route named under Submit here and confirmed by the form receipt or the named physical handoff. Not in Schoology: that is where the report-card grade appears later.