
Hear it. Describe it. Explain it.
Today's Lesson · Thu 10/15 · Wk8 · The physical exam: Look, then Listen and test
Open today's complete lesson in Schoology (opens in a new tab)Follow that lesson for today's required work and what to turn in. Use the downloads below when its steps ask you to analyze sounds.
Download the named heart, lung and blood-pressure sounds, then use the illustrated guide to connect what you hear to its source in the body and what a physician would investigate. These 25 synthesized teaching simulations have not been clinically validated. They support comparison practice and cannot establish a diagnosis.
For Listen and Test: compare normal S1 and S2 with the holosystolic murmur. Then compare normal vesicular breath sounds with expiratory wheeze, fine late inspiratory crackles, rhonchi and inspiratory stridor. Open the named MP3s below and use the guide for each comparison.
Listen at a comfortable volume with headphones if available. Replay the same example before comparing it. Describe timing, pitch and sound quality before interpreting it. If the classroom stethoscope gives a faint or unclear sound, record "not clearly heard" and use the simulation for the assigned comparison. Do not invent an observation.
Open all 25 named MP3s: preview or download
Lung sounds
Normal vesicular breath sounds (simulated)
LUNG_01_Normal_Vesicular_SIMULATED.mp3
Normal bronchovesicular breath sounds (simulated)
LUNG_02_Normal_Bronchovesicular_SIMULATED.mp3
Normal bronchial and tracheal breath sounds (simulated)
LUNG_03_Normal_Bronchial_Tracheal_SIMULATED.mp3
Expiratory wheeze (simulated)
LUNG_04_Expiratory_Wheeze_SIMULATED.mp3
Biphasic wheeze (simulated)
LUNG_05_Biphasic_Wheeze_SIMULATED.mp3
Fine late inspiratory crackles (simulated)
LUNG_06_Fine_Late_Inspiratory_Crackles_SIMULATED.mp3
Coarse inspiratory crackles (simulated)
LUNG_07_Coarse_Inspiratory_Crackles_SIMULATED.mp3
Rhonchi (simulated)
LUNG_08_Rhonchi_SIMULATED.mp3
Inspiratory stridor (simulated)
LUNG_09_Inspiratory_Stridor_SIMULATED.mp3
Pleural friction rub (simulated)
LUNG_10_Pleural_Friction_Rub_SIMULATED.mp3
Normal versus reduced air entry comparison (simulated)
LUNG_11_Normal_vs_Reduced_Air_Entry_COMPARISON_SIMULATED.mp3
Heart sounds
Normal S1 and S2 at 75 beats per minute (simulated)
HEART_01_Normal_S1_S2_75bpm_SIMULATED.mp3
Physiological respiratory split of S2 (simulated)
HEART_02_Physiological_Respiratory_Split_S2_SIMULATED.mp3
Additional S3 heart sound (simulated)
HEART_03_Additional_S3_SIMULATED.mp3
Additional S4 heart sound (simulated)
HEART_04_Additional_S4_SIMULATED.mp3
Systolic ejection crescendo-decrescendo murmur (simulated)
HEART_05_Systolic_Ejection_Crescendo_Decrescendo_SIMULATED.mp3
Holosystolic murmur (simulated)
HEART_06_Holosystolic_Murmur_SIMULATED.mp3
Early diastolic decrescendo murmur (simulated)
HEART_07_Early_Diastolic_Decrescendo_Murmur_SIMULATED.mp3
Mid-diastolic low rumble (simulated)
HEART_08_Mid_Diastolic_Low_Rumble_SIMULATED.mp3
Pericardial friction rub (simulated)
HEART_09_Pericardial_Friction_Rub_SIMULATED.mp3
Blood-pressure sounds
Korotkoff phase 1: first repetitive taps, systolic onset (simulated)
BP_01_Korotkoff_Phase_1_First_Repetitive_Taps_Systolic_Onset_SIMULATED.mp3
Korotkoff phase 2: swishing (simulated)
BP_02_Korotkoff_Phase_2_Swishing_SIMULATED.mp3
Korotkoff phase 3: clearer taps (simulated)
BP_03_Korotkoff_Phase_3_Clearer_Taps_SIMULATED.mp3
Korotkoff phase 4: muffling (simulated)
BP_04_Korotkoff_Phase_4_Muffling_SIMULATED.mp3
Complete staged blood-pressure measurement, 120/80 mm Hg, plays once (simulated)
BP_05_Complete_120_80_Staged_Measurement_NONLOOP_SIMULATED.mp3
Earlier portal reference material (before the class was repaced)
Use the Schoology lesson above for today's required work; this older reference follows an earlier schedule.
Simulated bloodwork data
This page has four parts, in the order you use them. Part 1 is what you need to know. Part 2 says what to do, in plain English. Part 3 shows the work done once on a case that is not yours. Part 4 is your own work and where to turn it in.
Open your materials, follow the steps, then turn in your work.
Collect and chart simulated bloodwork data over time following an SOP.
Check you have the right sheet: the top of it prints today's portal day, Simulated bloodwork data. The PLTW activity itself is in myPLTW and is not posted here.
Optional: listen or watch a unit review▸
Part 1 of 4 · Background and definitions▸
💡 Big idea: A time-series graph plots each value against time and its , so a rising or falling line makes a real trend visible in a way a column of numbers cannot, which is why graphing is the foundation of chronic-disease monitoring.
- • A time-series graph has time on the x-axis and the measured variable on the y-axis; data points are connected with a line to show change over time.
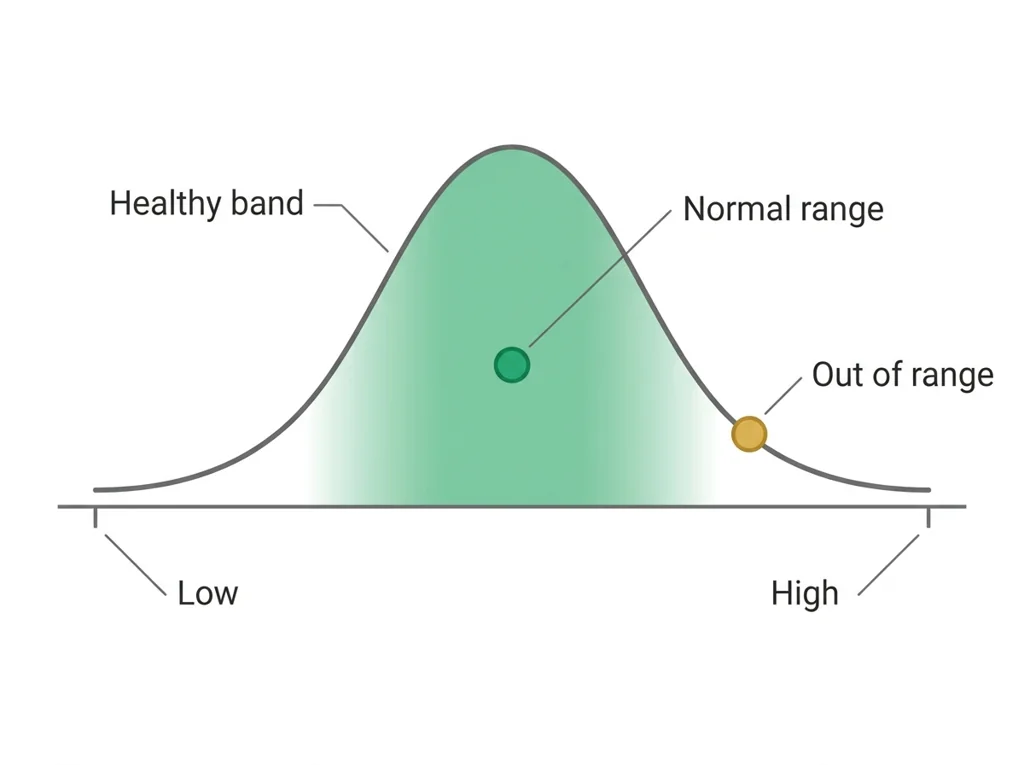
- • The band (shaded or bounded by two lines) provides the visual reference for whether each data point represents a concern.
- • Limitations of a simulated dataset include the absence of confounding variables, missing data points, and values that may not reflect real patient variability.
A blood panel measures organ function as numbers, so comparing each value to its and tracking it over repeated tests lets a clinician catch disease that a single reading or a physical exam would miss.
A time-series graph plots each value against time and its , so a rising or falling line makes a real trend visible in a way a column of numbers cannot, which is why graphing is the foundation of chronic-disease monitoring.
Driving question: You have eight fasting glucose readings for one simulated patient, taken over one month. How do you turn those eight numbers into a single picture that shows whether this patient is getting better or worse?
What you already know: A blood panel measures organ function as numbers, so comparing each value to its and tracking it over repeated tests lets a clinician catch disease that a single reading or a physical exam would miss.
New idea: A time-series graph plots each value against time and its , so a rising or falling line makes a real trend visible in a way a column of numbers cannot, which is why graphing is the foundation of chronic-disease monitoring.
Visual or model: No figure is attached to this lesson. The readings, the worked example and E1 to E3 carry the evidence.
- Observe or measure the relevant feature in simulated bloodwork data.
- Organize the observation with a stable evidence ID.
- Apply this rule: A useful test links a controlled trial to a measurable criterion and turns the result into a documented revision decision.
- Choose the option the evidence supports and state the limit of the conclusion.
Real biomedical example: You have eight fasting glucose readings for one simulated patient, taken over one month. How do you turn those eight numbers into a single picture that shows whether this patient is getting better or worse?
What the evidence supports: E1 to E3 support the daily take-home when the response meets the stated success criteria.
What it cannot prove: The package does not support claims beyond this lesson's or any real patient diagnosis.
- • : The amount of sugar dissolved in the blood, the body's main fuel, normally about 70 to 99 mg/dL when fasting and tightly controlled by .
- • : A waxy, fat-like substance that the body uses to build cell membranes and make hormones, but too much in the blood can clog arteries.
- • : Anything that raises a person's chance of developing a disease, such as smoking, family history, or high , without guaranteeing it.
- • telehealth: Delivering healthcare remotely using video calls, phone, or digital tools so patients and providers can connect without being in the same place.
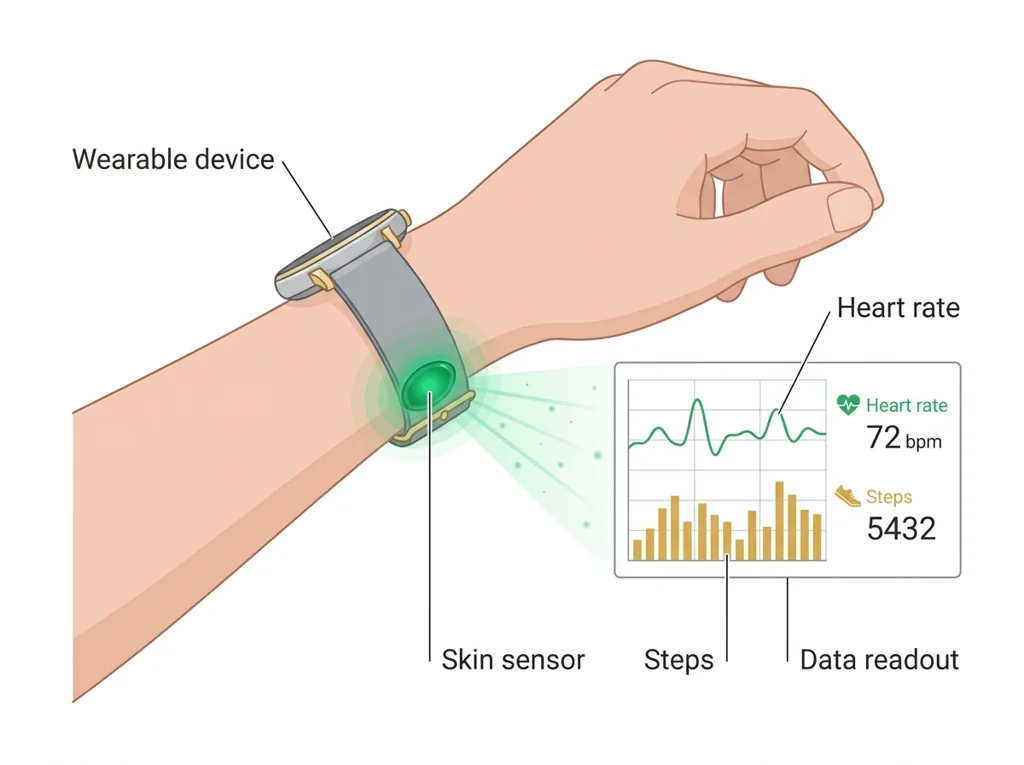
- • wearable: A small electronic device worn on the body that continuously senses and records health data such as heart rate, steps, or oxygen level.
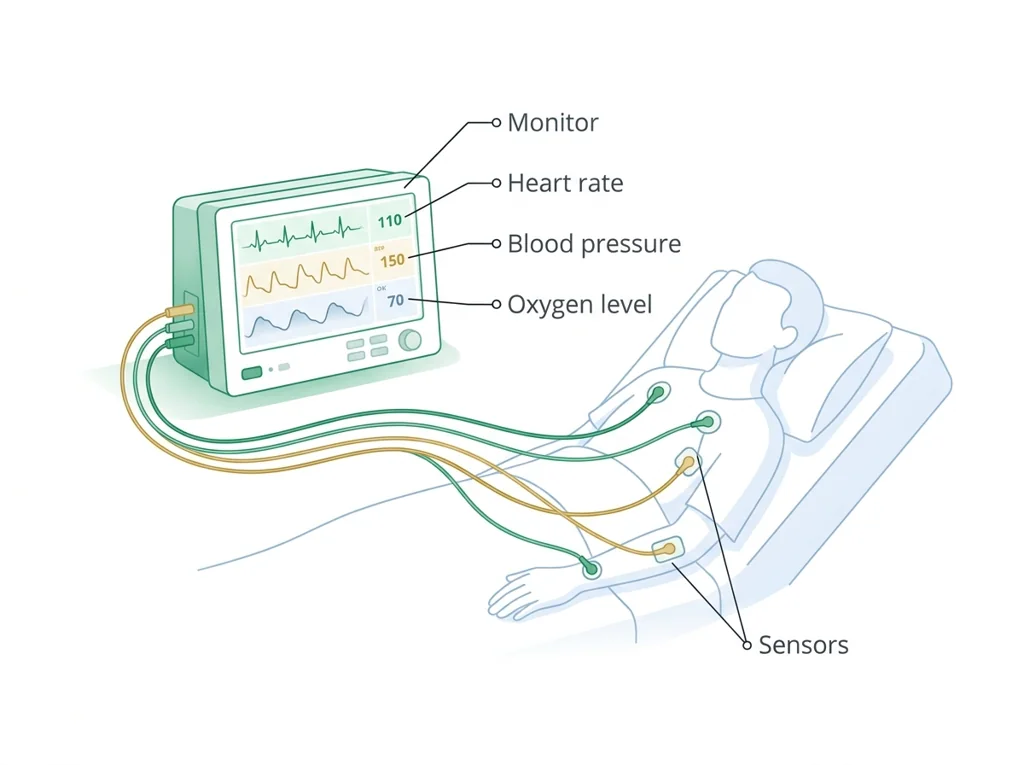
- • monitoring: The ongoing measurement of a patient's vital signs or condition over time to track changes and catch problems early.
- • : The span of values for a lab test or measurement seen in healthy people, used as a reference to flag results that may signal a problem.
Use it now: Choose one decision option. Cite E1 and E3, then explain how the rule connects the evidence to your choice. This is thinking practice for the one turn-in named under Turn in, not a second submission.
Go further, optional: The source links below are optional enrichment. Every fact required for today's local evidence decision appears in this lesson package.
Biomedical evidence supports a conclusion only to the level allowed by the measurement, comparison, controls, source quality, and uncertainty in the investigation.
Limit: The classroom evidence supports the stated learning decision, not a real clinical diagnosis, causal conclusion, or treatment recommendation.
A useful test links a controlled trial to a measurable criterion and turns the result into a documented revision decision.
Limit: A classroom test can reveal a design weakness without establishing clinical , effectiveness, durability, or regulatory readiness.
You can collect and chart longitudinal bloodwork data.
Limit: E3 defines the classroom product or success criterion. It is not independent scientific evidence and cannot justify a clinical or causal claim.
Today's decision · Simulated classroom evidence scenario
Your role: biomedical team member
Decision: Your team must decide what the evidence from simulated bloodwork data supports before submitting the labeled and result claim named on today's page.
- • Graph the eight values against time and stop there, since the line already shows whether the patient improved.
- • Hold the chart until each reading is confirmed collected under the 's conditions, since an off-protocol draw shifts the line.
- • Plot all eight readings against time and shade the normal-range band, so the trend gains clinical meaning.
Response: State one choice, cite at least two evidence IDs, explain the rule that connects them, and add one limitation. Use it inside the one turn-in named under Turn in; it is not a separate submission.
Claim ceiling: Today's evidence supports a classroom claim about simulated bloodwork data. It cannot prove causation, diagnose a real patient, or justify action outside this room.
Reason for review: Your team must decide what the evidence from simulated bloodwork data supports before submitting the labeled and result claim named on today's page.
Context: Plotting a clinical value over time against its makes the difference between a one-time blip and a real trend visible, and that picture is the foundation of monitoring a chronic disease.
- • T1: Read the rules on your student sheet, then open the simulated practice patient record in Part 2 of this page.
- • T2: Copy every value into your with its date, unit, adult reference range, and a flag for inside or outside the range.
- • T3: Build a labeled line graph of fasting glucose across the eight visits: date on the x-axis, mg/dL on the y-axis.
- • T4: Shade the 70 to 99 mg/dL normal band and mark each point outside it.
- • T5: Add your two microscope drawings and your written comparison of the slides, then record one limitation of the practice record.
- • E1: Biomedical evidence supports a conclusion only to the level allowed by the measurement, comparison, controls, source quality, and uncertainty in the investigation.
- • E2: A useful test links a controlled trial to a measurable criterion and turns the result into a documented revision decision.
- • E3: You can collect and chart longitudinal bloodwork data.
Measurements: Use only the measurements, units, graph, or counts supplied in today's task. No additional patient measurement is implied.
Uncertainty: This is a composite classroom scenario. Missing history, measurements, or confirmation tests remain unknown and limit the conclusion.
Change per visit = (last minus first) divided by the number of steps = (122 minus 98) / 7 = 24 / 7, about 3.4 mg/dL per visit. With the fasting band at 70 to 99 mg/dL, the line first sits above the band at visit 2 (101).
A warm-up set (not the practice patient record you graph): fasting glucose at eight visits, in mg/dL, 98, 101, 104, 108, 111, 115, 118, 122. What is the change per visit, and where does the line cross the normal band?
A per-visit change should be small next to the values themselves; a jump of 20 or more in one step is worth rechecking against the sheet. The band comes from the report, not from memory.
For your marker, compute the change per visit from first to last, mark the first visit above the band on your graph, and write both next to the line.
Students often think any graph of the data is enough, and skip drawing the normal-range band. The trap: Without the shaded normal-range band, a data point has no reference, so you cannot tell if a value is fine or dangerous; the band is what turns a plotted number into a clinical judgment.
- CER:
- Claim, Evidence, Reasoning: make a claim, back it with evidence, explain your reasoning.
- SOP:
- Standard Operating Procedure, the exact steps to follow (especially in a lab).
- Tracker:
- Your PLTW progress log where you record completed evidence.
- myPLTW:
- The PLTW course site where you do the online activities. Find it in Clever with your Microsoft sign-in, right next to Schoology.
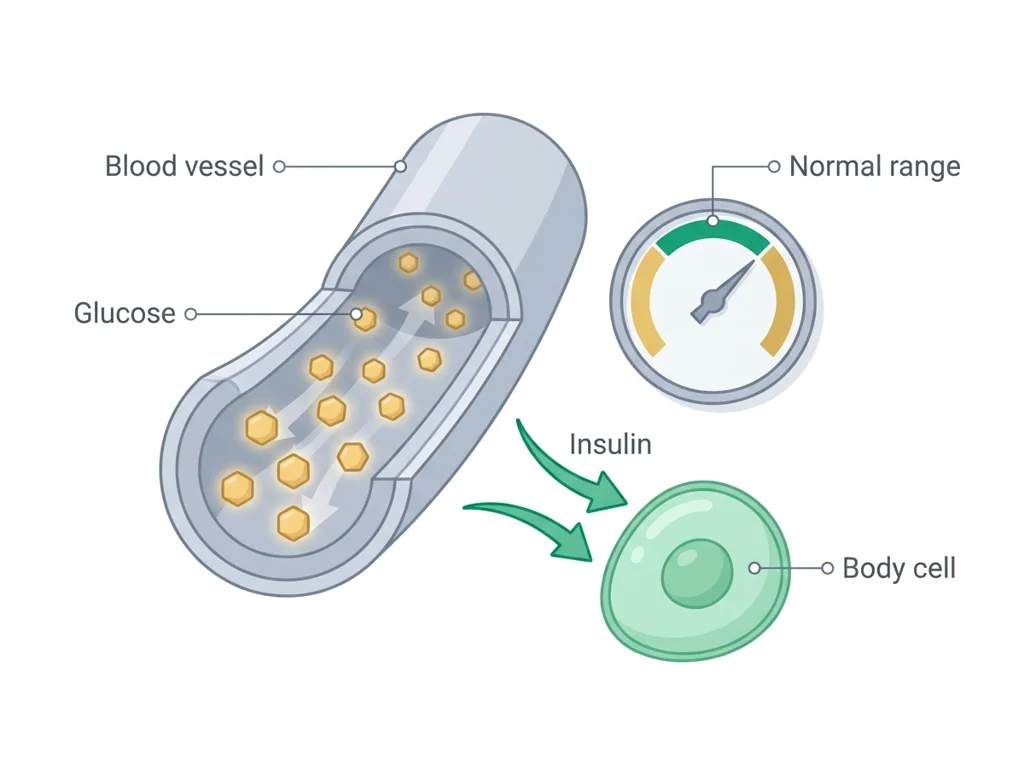
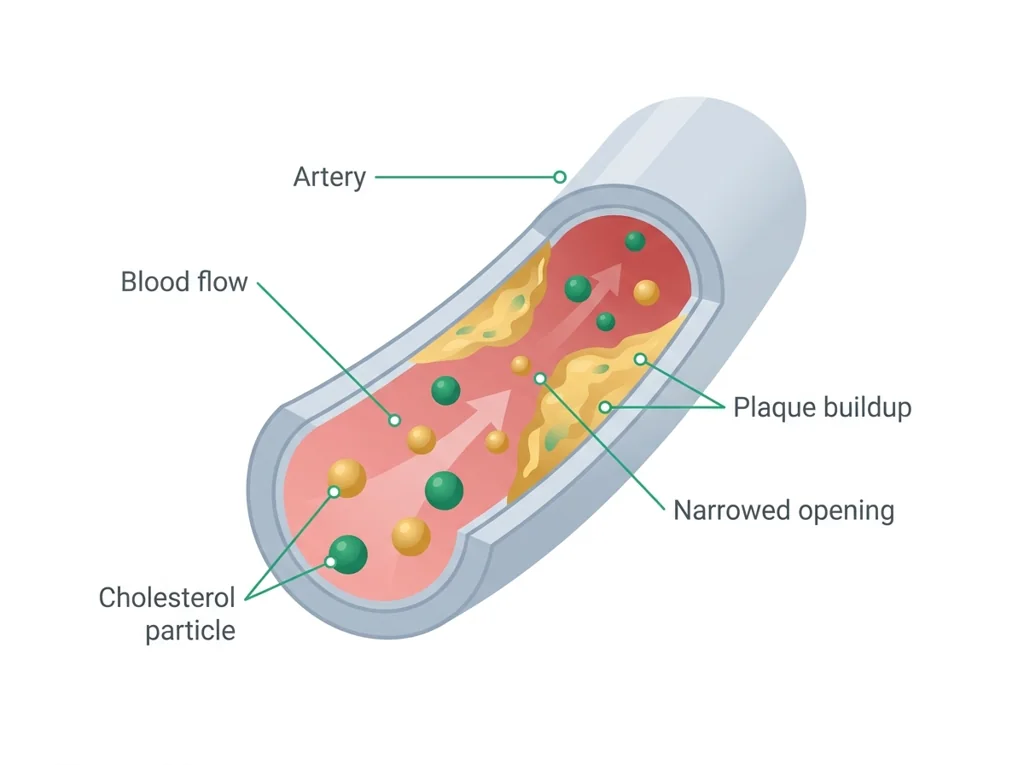
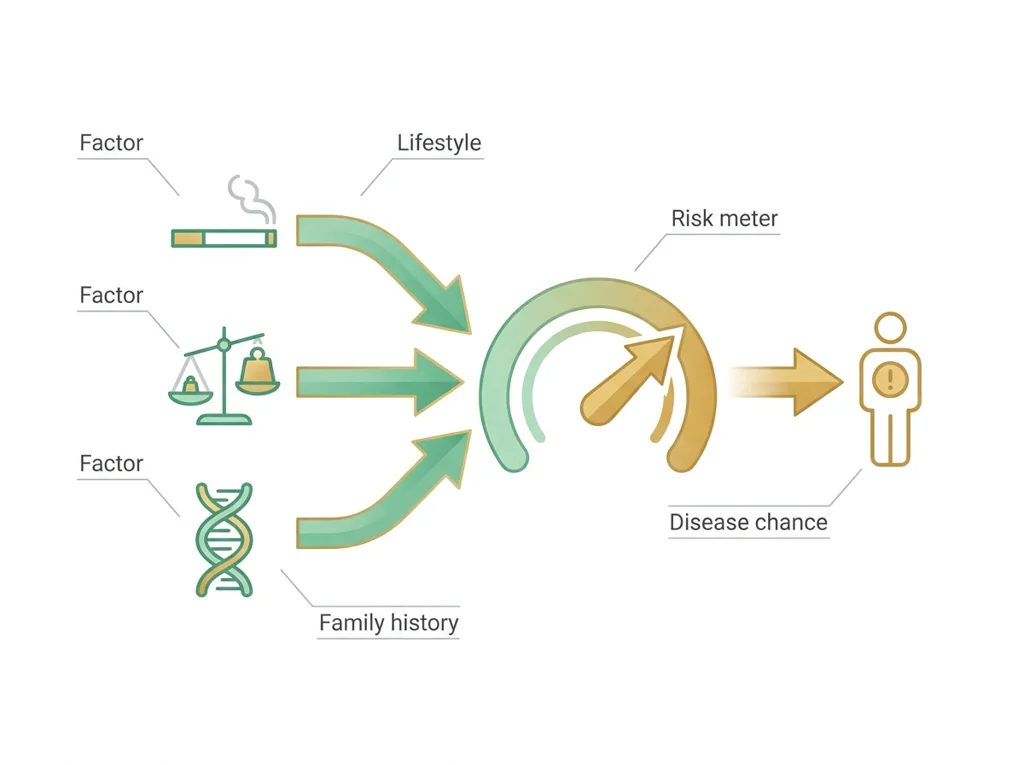
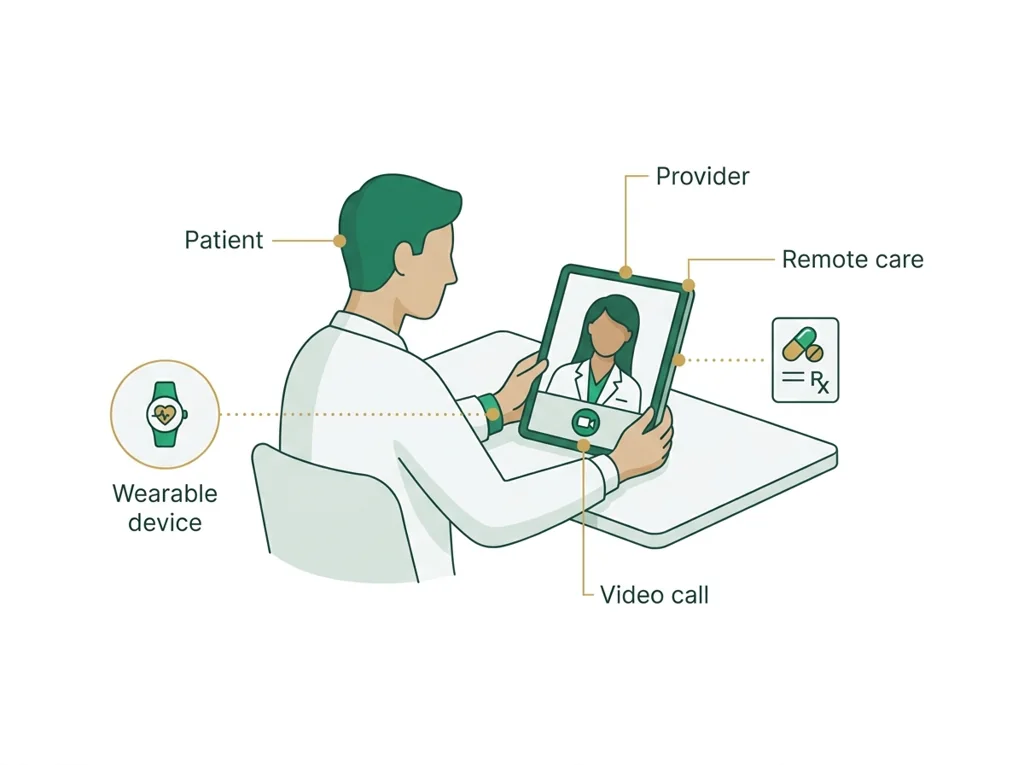
Tap the speaker to hear a term. Add two of these to your notebook glossary with a definition and an example in your own words.
Pick just 2 or 3 words from today and make them yours: write what each one means in your own words, name the context clue or evidence that helped, then give one example from what you actually did in Simulated bloodwork data. Try your own words first; the glossary is there if you get stuck. This is voluntary and counts as extra credit, so keep it short.
Saved on this device. Show Mr. Mendoza or add these to your notebook glossary to claim the extra credit.
Part 2 of 4 · Directions in plain English▸
2.1 Open your materials
Use the materials named in the first step below. Open lesson resources.
Simulated practice patient record (made-up practice data, not a real patient and not anyone in a class case)
Practice patient P-30, an adult woman. Eight fasting blood draws over 30 days. All values in mg/dL.
| Blood draw number | Date | Fasting blood sugar (glucose) | Total cholesterol | HDL (the "good" cholesterol) | LDL (the "bad" cholesterol) |
|---|---|---|---|---|---|
| 1 | Sep 1 | 98 | 214 | 46 | 138 |
| 2 | Sep 5 | 104 | 209 | 45 | 134 |
| 3 | Sep 9 | 101 | 218 | 47 | 141 |
| 4 | Sep 13 | 109 | 212 | 44 | 137 |
| 5 | Sep 17 | 114 | 216 | 46 | 140 |
| 6 | Sep 21 | 112 | 220 | 45 | 144 |
| 7 | Sep 25 | 119 | 215 | 44 | 139 |
| 8 | Sep 30 | 127 | 219 | 46 | 143 |
Adult reference ranges
- Fasting glucose: 70 to 99 normal; 100 to 125 prediabetes range; 126 or higher diabetes range, on repeat testing.
- Total cholesterol: under 200 desirable.
- HDL: 40 or higher for men, 50 or higher for women.
- LDL: under 100 optimal.
2.2 Start the work
Read the safety rules on your student sheet, then open the simulated practice patient record in Part 2 of this page.
Show all 5 required steps
- Read the safety rules on your student sheet, then open the simulated practice patient record in Part 2 of this page.
- Copy every value into your data table with its date, unit, adult reference range, and a flag for inside or outside the range.
- Build a labeled line graph of fasting glucose across the eight visits: date on the x-axis, mg/dL on the y-axis.
- Shade the 70 to 99 mg/dL normal band and mark each point outside it.
- Add your two microscope drawings and your written comparison of the slides, then record one limitation of the practice record.
Lost your place? Back after a break? Check that every value from the practice patient record is in your data table with its unit, range and flag (step 2), that your glucose graph is labeled (step 3) and shows the shaded band (step 4). Then add the slide drawings and one limitation (step 5).
- 0:00Review how to build a time-series graph (quick demo with an example dataset)
- 0:10Open the practice patient record on this page; read the rules on your sheet
- 0:18Record all glucose and values with their time points in a
- 0:32Build a labeled line graph for your chosen marker: title, x-axis (time), y-axis (marker + units), data points connected
- 0:52Mark the band on the graph; annotate any points outside the range
- 1:02Record one limitation of the practice record and finish the slide comparison
- 1:10Pair-compare graphs; preview the trend-analysis lesson that follows
- • Today we work with the simulated practice patient record in Part 2 of this page. This patient had fasting glucose and checked eight times in one month. Your job is to record the data, graph it, and read the trend.
- • When you draw the graph, the goes on as a band. Every point above that band is a clinical concern. Every point below that band is also information. The trend is what tells the story.
- • Real clinical data is messy: missing appointments, inconsistent lab timing, different labs with slightly different reference ranges. Our simulated data will be cleaner, but we will still practice identifying its limitations.
- • By the end of class you will have a graph that tells the story of this patient's month at a glance.
PLTW connection and today's work
In myPLTW, go back to Activity 2.1.4 Routine Testing: In the Lab in Lesson 2.1 Talk to Your Doc and record your simulated patient bloodwork data there.
Today's stopping point: By the end of today your data table, your glucose graph and your slide comparison should all be done.
PLTW activity titles identify the course connection. If your account will not open, use the posted materials for today and tell Mr. Mendoza. Do not mark an online activity complete unless you completed it.
Course connection
- Activity 2.1.4 Routine Testing: In the Lab
Use the turn-in directions in Part 4 of this page. Do not create a second submission unless your teacher asks for one.
Show another explanation or a smaller first step
Need help? Choose a starting point
Finish the assigned lab safely before starting extra practice.
Part 3 of 4 · Worked example▸
This is a parallel case, not your own. Read it for the order of the work, then do your own in Part 4.
Simulated glucose data for Patient A over four visits:
- Month 0: 105 mg/dL
- Month 3: 118 mg/dL
- Month 6: 130 mg/dL
- Month 9: 145 mg/dL
Graph notes: time (months) goes on the x-axis, glucose (mg/dL) on the y-axis, points connected by a line. I shaded the normal band from 70 to 99 mg/dL. Every point is above the band, and the Month 9 point (145 mg/dL) is annotated as the highest out-of-range value.
Limitation: the simulated dataset has no missing visits and no confounding variables, so it looks cleaner than real patient data.
Error source: a non-fasting draw would falsely raise a glucose reading.
This model shows the level of evidence and organization needed to complete: A data table of simulated glucose and cholesterol values across several time points plus a labeled time-series line graph of one marker with the normal range band marked and one out-of-range point annotated.
- Name the variables and include units.
- Enter observations without changing the raw values.
- Check labels, calculations, and patterns before interpreting the data.
Keep the structure. Replace the question, facts, measurements, and evidence. Then recheck units, vocabulary, and whether the conclusion goes beyond the evidence.
Also due today: Submit the table, graph and drawings as one PDF to Schoology assignment for this lesson in Schoology before leaving class.
An engineering team tests one feature at a time against a written criterion and records each failure before revising.
- Which criterion is being tested?
- What stays controlled between trials?
- Which result justifies a specific revision?
A useful test links a controlled trial to a measurable criterion and turns the result into a documented revision decision.
A classroom test can reveal a design weakness without establishing clinical , effectiveness, durability, or regulatory readiness.
- • The written criterion maps to the pass condition.
- • Repeated controlled trials map to test evidence.
- • The revision log maps to the next design change and its rationale.
Part 4 of 4 · Your work▸
Check your work before submitting
- I can collect and chart longitudinal bloodwork data.
- I can mark normal ranges on a time-series graph.
Before lab work: read the safety rules
- If the phlebotomy training arm station on your sheet runs: the tourniquet comes off before the needle comes out, needles go only into the sharps container and are never recapped, and gloves stay on until the station is wiped down.
- Microscope slides: carry them by the edges, report any chipped slide to Mr. Mendoza, and wash your hands after the station.
- No human blood is used today and nobody does a fingerstick. The glucose meter is demonstrated only with its control liquid, never with blood.
4.1 Turn in your work
DueCheck the Schoology assignment for this day- Hand in
- One data table covering every value in the practice patient record (date, test, value, unit, reference range, and an inside-or-outside flag), a labeled line graph of fasting glucose with the 70 to 99 mg/dL band shaded and out-of-range points marked, your two microscope drawings with a written comparison, and one limitation of the record.
How to submit and name your file
Submit the table, graph and drawings as one PDF to the Schoology assignment for this lesson in Schoology before leaving class.
In Schoology, open your course and the assignment for this lesson. Attach your file, select Submit, and check that it appears in the submission.
PDF upload helpYou get two school days for every day you were absent, so this deadline moves with you.
Today's lesson is in Schoology
Each school day has one lesson page in Schoology that holds everything for the day: the goal, the story so far, every table and data value, the numbered steps, and what to turn in. Open it first and work from it. The other rows for this day, if any, are the score line for a paper quiz or test and the John Carroll debate item; they do not add work. Check Schoology for each deadline.
- Today's Lesson · Thu 10/15 · Wk8 · The physical exam: Look, then Listen and test(today's lesson page: the goal, the data, the steps, and what to turn in are all on it)
Link will not open? Open Schoology, choose your course and section, and find the title shown above.
- CompleteEvery required part of the artifact is present, nothing left blank.
- AccurateThe science and the data are correct and match the evidence.
- Scientific reasoningYou explain your claim with evidence and reasoning (CER), not just an answer.
- Professional communicationClear, organized, labeled, and written the way a clinician or scientist would.
- SubmittedGo to Schoology to turn this in. Submit one PDF. Schoology attaches your name to your upload; on the page itself, write your period and code. Name the file: FirstName LastName - Assignment Title - YYYY-MM-DD.pdf. If you cannot get in, see Mr. Mendoza. Do not skip the work.
- Error analysis and method · counts doubleName a specific limit of the method and how it moved your result, and compare what you predicted to what happened. "Human error" does not count; say what about the procedure or instrument caused it.
How this lesson connects
Keep using what you learned last class: A blood panel measures organ function as numbers, so comparing each value to its normal range and tracking it over repeated tests lets a clinician catch disease that a single reading or a physical exam would miss. Today: A time-series graph plots each value against time and its normal range, so a rising or falling line makes a real trend visible in a way a column of numbers cannot, which is why graphing is the foundation of chronic-disease monitoring.
Practice: try a question, then check your answer▸
Claim ceiling for this check: Today's evidence supports a classroom claim about simulated bloodwork data. It cannot prove causation, diagnose a real patient, or justify action outside this room.
You plotted a patient's glucose over one month but forgot to draw the normal-range band. Why does that missing band make your graph hard to interpret clinically?
Write an answer and pick a confidence to unlock the key.
Fast retrieval with instant answers, not the commit-then-reveal check above. Try each from memory first: write what you remember about the earlier units, then check yourself here.
Missed class or ready for more?▸
I can name the procedure's purpose and the evidence I will record. I can name today's hazards and the control for each: If the phlebotomy training arm station on your sheet runs: the tourniquet comes off before the needle comes out, needles go only into the sharps container and are never recapped, and gloves stay on until the station is wiped down. My data table is ready before materials are handled.
Finish the checklist before you handle any material.
- • If the phlebotomy training arm station on your sheet runs: the tourniquet comes off before the needle comes out, needles go only into the sharps container and are never recapped, and gloves stay on until the station is wiped down.
- • Microscope slides: carry them by the edges, report any chipped slide to Mr. Mendoza, and wash your hands after the station.
- • No human blood is used today and nobody does a fingerstick. The glucose meter is demonstrated only with its control liquid, never with blood.
- 1Before materials are handled, identify the purpose, variables or comparison, controls, measurement units, and stop-work condition.
- 2Read the safety rules on your student sheet, then open the simulated practice patient record in Part 2 of this page.
- 3Copy every value into your data table with its date, unit, adult reference range, and a flag for inside or outside the range.
- 4Build a labeled line graph of fasting glucose across the eight visits: date on the x-axis, mg/dL on the y-axis.
- 5Shade the 70 to 99 mg/dL normal band and mark each point outside it.
- 6Add your two microscope drawings and your written comparison of the slides, then record one limitation of the practice record.
- 7Record each result in the prepared table before interpreting it. Mark missing, repeated, or invalid results truthfully.
- 8Complete the named cleanup and waste route, remove PPE safely, wash hands when required, and confirm the station is ready for the next group.
| Which trial or sample this row is | What you changed on purpose | What you measured, with units | What you saw, before you explain it | Anything that could make this reading wrong |
|---|---|---|---|---|
Before the procedure, predict the result and cite the rule behind the prediction.
After the procedure, compare the result with the prediction and name one limitation or source of uncertainty.
What today's skills lead to. These are real health-science careers this course builds toward. Tap one to see, on the US Department of Labor's O*NET site, what the job actually involves, what it pays, and how fast it is growing.
Use the simulated practice patient record in Part 2 of this page to build the with ranges and flags and a labeled glucose graph with the normal band shaded, and note one limitation.
NIH MedlinePlus Lab TestsSubmit the table, graph and drawings as one PDF to the Schoology assignment for this lesson in Schoology before leaving class.
Class still runs. Complete today's work as this page describes (it is self-guided). Need the concept taught without a teacher? Use this authoritative explainer:
MedlinePlus: Laboratory TestsSources: slides, readings, and resources▸
The deck carries the prior idea forward, lets you inspect an analogy, maps the rule to biology, and ends with the same evidence decision and exit ticket used on this page.
Hand-picked readings and interactives for this lesson, from authoritative open organizations and PLTW's own public course outline.
This week
My Progress dashboard