

Differential expression, fold change, correlation, disease risk vs. diagnosis.
Your PLTW coursework: Medical Interventions ▸ Unit 3: How to Conquer Cancer ▸ Lesson 3.1 Detecting Cancer ▸ "Activity 3.1.4 DNA Microarray", "Activity 3.1.5 Unlocking the Secrets in Our Genes"
What to do if absent- CER:
- Claim, Evidence, Reasoning: make a claim, back it with evidence, explain your reasoning.
- SOP:
- Standard Operating Procedure, the exact steps to follow (especially in a lab).
- Tracker:
- Your PLTW progress log where you record completed evidence.
- myPLTW:
- The PLTW course site where you do the online activities. Find it in Clever with your Microsoft sign-in, right next to Schoology.
Week overview - Heat Maps and Hunches: Reading Gene Expression
Use a heat map and fold-change values to make a claim about which genes are in a disease sample.
- 1Open the spreadsheet heat-map file in the PLTW course shell and read the color key before touching the numbers.
- 2Pick two genes and write down whether each is or in the disease column.
- 3Calculate or read the fold change for those two genes and circle the larger change.
- 4Make a simple scatter of two samples and describe in one sentence whether they show correlation.
- 5Write a claim that names one gene linked to disease risk, then add evidence from your fold-change number.
- 6Add one sentence on why higher risk is not the same as a diagnosis, ready to share out.
- • You'll be able to read a heat map to spot up- and down-regulated genes.
- • You'll be able to interpret a fold-change value as evidence.
- • You'll be able to explain the difference between risk and diagnosis.
Daily lessons this week
Open any day for its full lesson, the work due that day, and guided notes.
Fold-change table for four genes with / labels and one sentence on the biological meaning of an upregulated gene.
Shaded heat map of four genes and a CER claim (claim, two fold-change values as evidence, reasoning) that distinguishes risk from diagnosis.
Complete analysis report: fold-change , shaded heat map, and CER claim distinguishing disease risk from diagnosis.
Quick intro to the week
- Today matters because a single chip can show which genes are shouting or whispering inside a patient's cells.
- Goal for today: turn a colorful heat map into one solid, evidence-backed claim about .
- Tie back to Monday's debate: if expression data hints at future risk, who should be allowed to act on it?
- Your spreadsheet work and claim go in the PLTW course shell, which is where the grade is logged.
Your PLTW coursework this week
Do this: Advance the Unit 3 gene-expression benchmark by submitting your heat-map claim with fold-change evidence on the class site.
- • is measured through mRNA levels, often shown as a heat map.
- • Fold change compares expression in one condition to another, showing up- or down-regulation.
- • Correlation between samples suggests a pattern but does not prove a diagnosis.
- • Read a heat map to identify and genes.
- • Use fold change as quantitative evidence for a claim.
📋 Tracker evidence due this week: your spreadsheet heat-map claim with fold-change evidence submitted to the class site.
All PLTW activities are completed inside the PLTW course environment: this page only gives direction.
This week's PLTW tracker
Your week at a glance. Check off each deliverable as you finish it, then submit so Mr. Mendoza can see how the class is pacing.
Use the code Mr. Mendoza gave you, not your name. Saved on this device.
| Day | Date | Focus | Key deliverable |
|---|---|---|---|
| Wednesday | Wed, Oct 21 | Expression data lab | Fold-change table for four genes with upregulated/downregulated labels and one sentence on the biological meaning of an upregulated gene. |
| Thursday | Thu, Oct 22 | Heat-map claim | Shaded heat map of four genes and a CER claim (claim, two fold-change values as evidence, reasoning) that distinguishes risk from diagnosis. |
| Friday | Fri, Oct 23 | Microarray report submit | Complete microarray analysis report: fold-change data table, shaded heat map, and CER claim distinguishing disease risk from diagnosis. |
- M: no school
- T: no school
- W: expression table
- Th: heat-map claim
- F: microarray report submit
Due by week's end: Microarray analysis report.
3 panels from the illustrated semester.
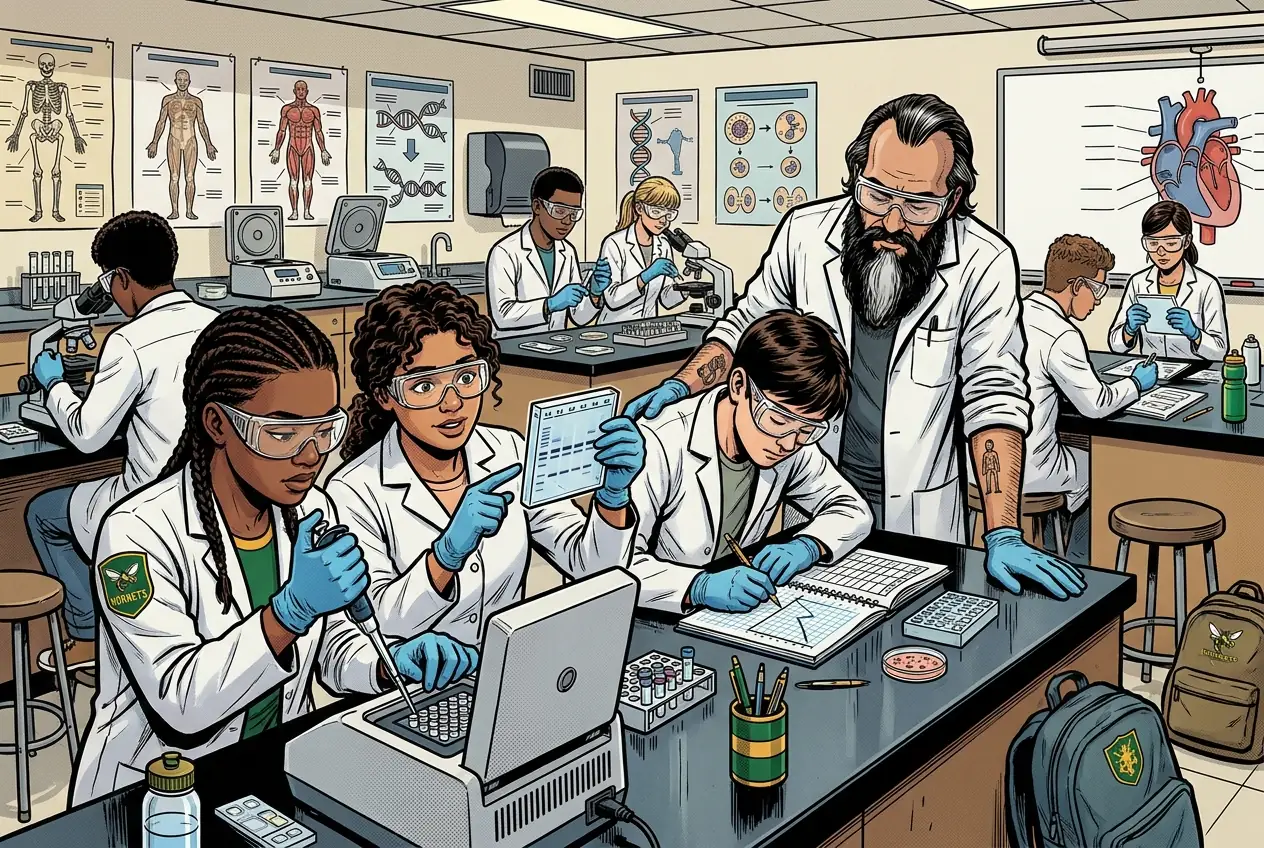
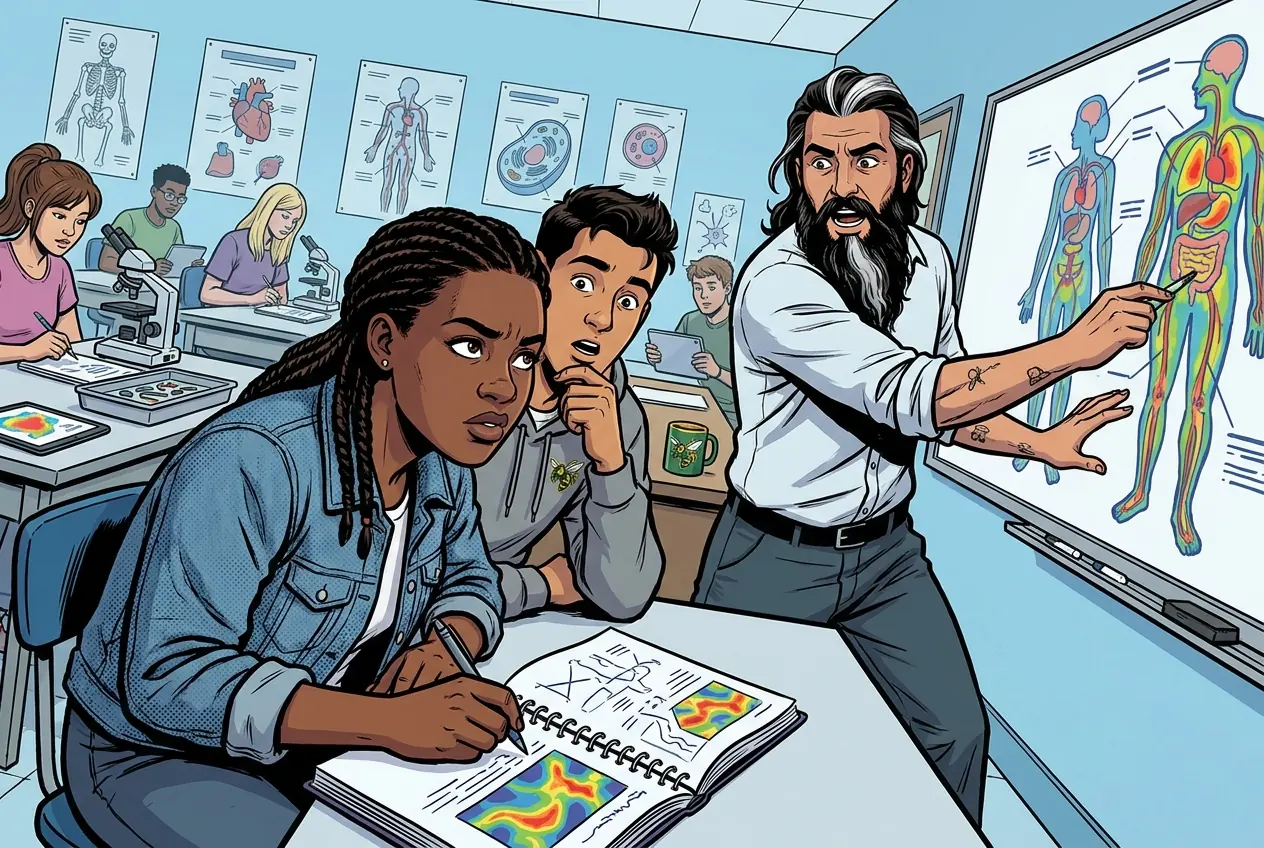
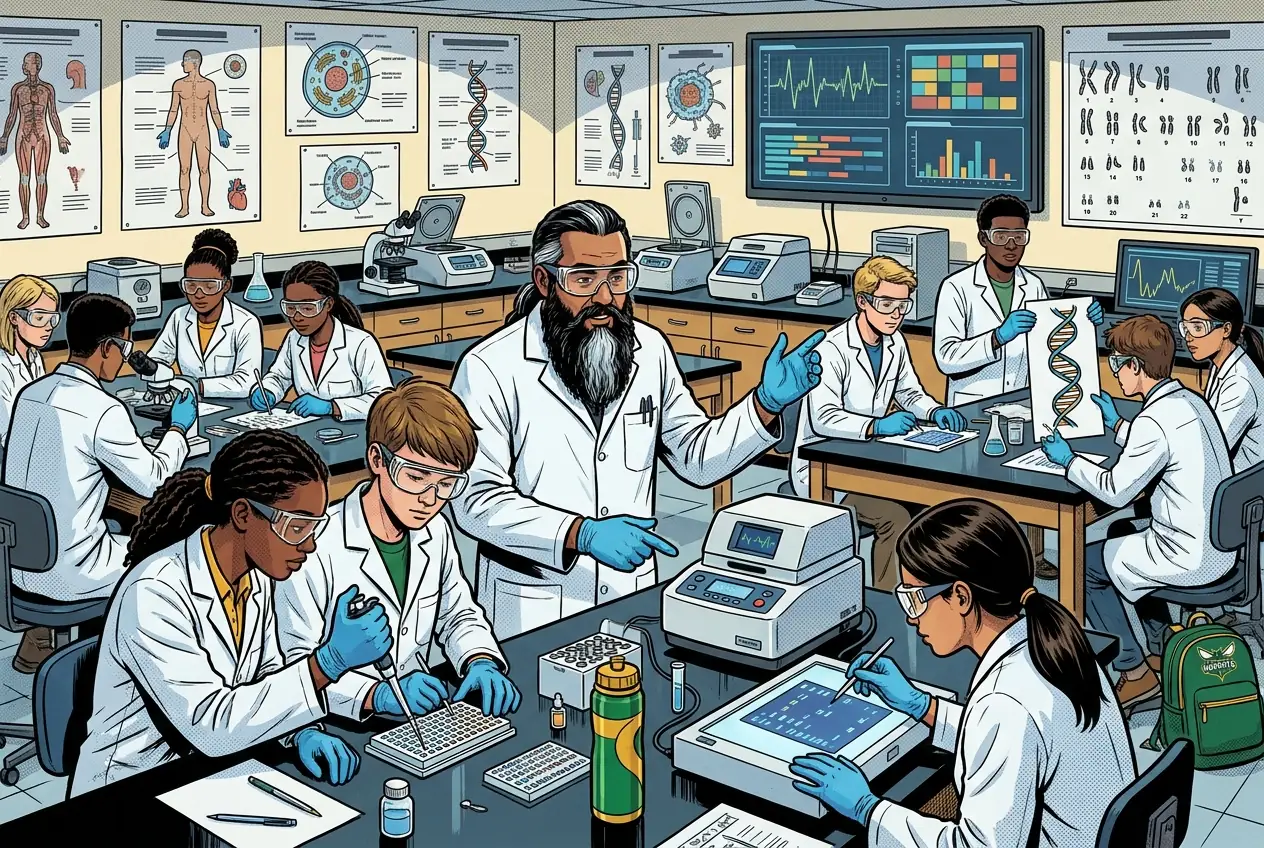
Fiction. There is no such student. The lessons, labs and dates are the real planned course; the student, the classmates and the conversations are invented.
Lab day: what to bring & watch
This explainer accompanies the PLTW lab protocol: watch it before lab.
What to do when absent
Most days, this class is your PLTW coursework: and PLTW is online and individual. So being out usually just means doing exactly what we did in class, from home.
Open Clever, then myPLTWHow to get there: open Clever and sign in with your Microsoft (district) account. Both myPLTW and Schoology are in Clever. Do the activity in myPLTW. Turn the work in on this site or hand it to Mr. Mendoza, because that is the step that counts as submitted. Schoology only shows your report-card grade later.
You can't do those from home: do this instead: Spreadsheet heat-map interpretation.
Class still runs. A substitute will post today's plan: complete the online activity above; it's built to be self-guided. Need the concept taught without a teacher? Use this authoritative explainer:
Genetic Science Learning Center: Genes and gene expressionVocabulary
Teacher-posted resources
Classroom documents for this lesson are posted in Schoology. Open Clever, then Schoology, and find each one by the name shown on its card.
Use this as the classroom resource for and analysis.
Placement rationale
Matched and analysis by path:Medical-Interventions/Unit-2_How-to-Screen-Your-Genes/00_Unit-Overview; keywords:gene expression, microarray. Score 138. Visibility: student-schoology (student-facing resource; link through Schoology rather than local path).
Use this if you were absent, got stuck, or need another pass before you submit the lesson artifact.
Placement rationale
Matched and analysis by path:Medical-Interventions/Unit-2_How-to-Screen-Your-Genes/00_Unit-Overview; keywords:microarray. Score 126. Visibility: student-schoology (student-facing resource; link through Schoology rather than local path).
Use this if you were absent, got stuck, or need another pass before you submit the lesson artifact.
Placement rationale
Matched and analysis by path:Medical-Interventions/Unit-2_How-to-Screen-Your-Genes/2.1_Genetic-Testing-and-Screening. Score 126. Visibility: student-schoology (student-facing resource; link through Schoology rather than local path).
How to get there: open Clever and sign in with your Microsoft (district) account. Both myPLTW and Schoology are in Clever. Do the activity in myPLTW. Turn the work in on this site or hand it to Mr. Mendoza, because that is the step that counts as submitted. Schoology only shows your report-card grade later.