

Evidence-based revision, Q&A, intro to physiology research design.
Your PLTW coursework: Biomedical Innovation ▸ Problem 2: Exploring Human Physiology ▸ "Project 2.1.1 Scientific Research"
What to do if absent- CER:
- Claim, Evidence, Reasoning: make a claim, back it with evidence, explain your reasoning.
- SOP:
- Standard Operating Procedure, the exact steps to follow (especially in a lab).
- Tracker:
- Your PLTW progress log where you record completed evidence.
- myPLTW:
- The PLTW course site where you do the online activities. Find it in Clever with your Microsoft sign-in, right next to Schoology.
Week overview - Pitch and revise: evidence-based feedback and intro to study design
Present your ER design for evidence-based feedback, revise one element, and design a simple physiology study with a hypothesis, variable, and control.
- 1Record a short walkthrough of your ER design that names the problem and your solution.
- 2Trade walkthroughs with a partner and give one piece of usability feedback backed by evidence.
- 3Pick the strongest feedback you received and revise one element of your design.
- 4Write a testable hypothesis for a simple physiology question, such as heart rate and activity.
- 5Identify the , , and control for that study.
- 6Critique one classmate's study design for a missing variable or control.
- • You will be able to give and receive evidence-based design feedback.
- • You will be able to revise a design based on usability feedback.
- • You will be able to write a hypothesis with a variable and a control.
Daily lessons this week
Open any day for its full lesson, the work due that day, and guided notes.
CER contribution on pre-release testing requirements for medical innovations, plus two questions and a reflection linking the argument to the ER prototype.
Presentation outline with problem-to-solution arc and selected evidence, plus submitted slide deck ready for Wednesday delivery.
Delivered ER design presentation with peer feedback notes and a written note on the one unanswered question and how you would address it.
Problem 2 launch: chosen physiological measure, identified independent/dependent/controlled variables, and a testable hypothesis.
Problem 2 research design ticket: study critique identifying variable/control/limitation flaws, plus a proposed sound design with hypothesis, variables, and planned measurements.
Quick intro to the week
- Hook: the best designers improve fastest because they ask for honest feedback and act on it.
- Today's goal: defend your ER design, revise one part, then step into physiology with a real study question.
- This week opened with a Monday bioethics debate; carry that habit of arguing from evidence into your critiques.
- Reminder: your graded walkthrough and study critique live in the PLTW course shell.
Your PLTW coursework this week
Do this: Advance from PLTW Problem 1 into Problem 2 by submitting your revised ER walkthrough and first study-design draft in the online course shell.
- • Iteration means improving a design across repeated feedback cycles.
- • A controlled study isolates one variable while holding others constant.
- • Revise a design using usability feedback.
- • Identify the , , and control in a study.
📋 PLTW evidence due: recorded ER walkthrough, one documented revision, and a study-design critique in the course shell.
All PLTW activities are completed inside the PLTW course environment: this page only gives direction.
This week's PLTW tracker
Your week at a glance. Check off each deliverable as you finish it, then submit so Mr. Mendoza can see how the class is pacing.
Use the code Mr. Mendoza gave you, not your name. Saved on this device.
| Day | Date | Focus | Key deliverable |
|---|---|---|---|
| Wednesday | Wed, Feb 24 | Innovation-safety debate | CER contribution on pre-release safety testing requirements for medical innovations, plus two questions and a reflection linking the argument to the ER prototype. |
| Thursday | Thu, Feb 25 | Presentation prep | Presentation outline with problem-to-solution arc and selected evidence, plus submitted slide deck ready for Wednesday delivery. |
| Friday | Fri, Feb 26 | ER presentation | Delivered ER design presentation with peer feedback notes and a written note on the one unanswered question and how you would address it. |
| Tuesday | Tue, Mar 2 | Physiology variables | Problem 2 launch: chosen physiological measure, identified independent/dependent/controlled variables, and a testable hypothesis. |
| Friday | - | Research design ticket | Problem 2 research design ticket: study critique identifying variable/control/limitation flaws, plus a proposed sound design with hypothesis, variables, and planned measurements. |
- M: innovation safety debate
- T: presentation prep
- W: ER presentation
- Th: Problem 2 variables
- F: research design ticket
Due by week's end: Problem 1 presentation/reflection and Problem 2 research design ticket.
5 panels from the illustrated semester.

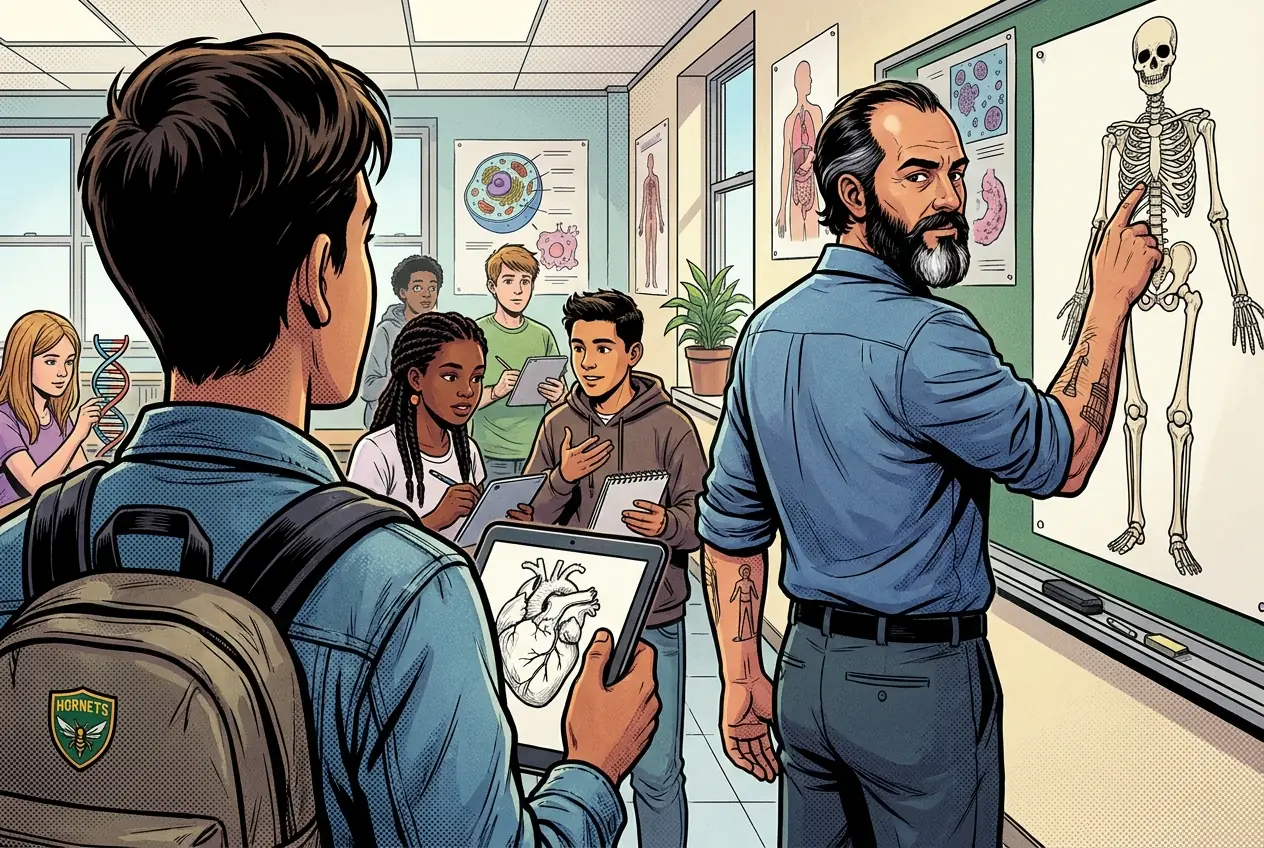
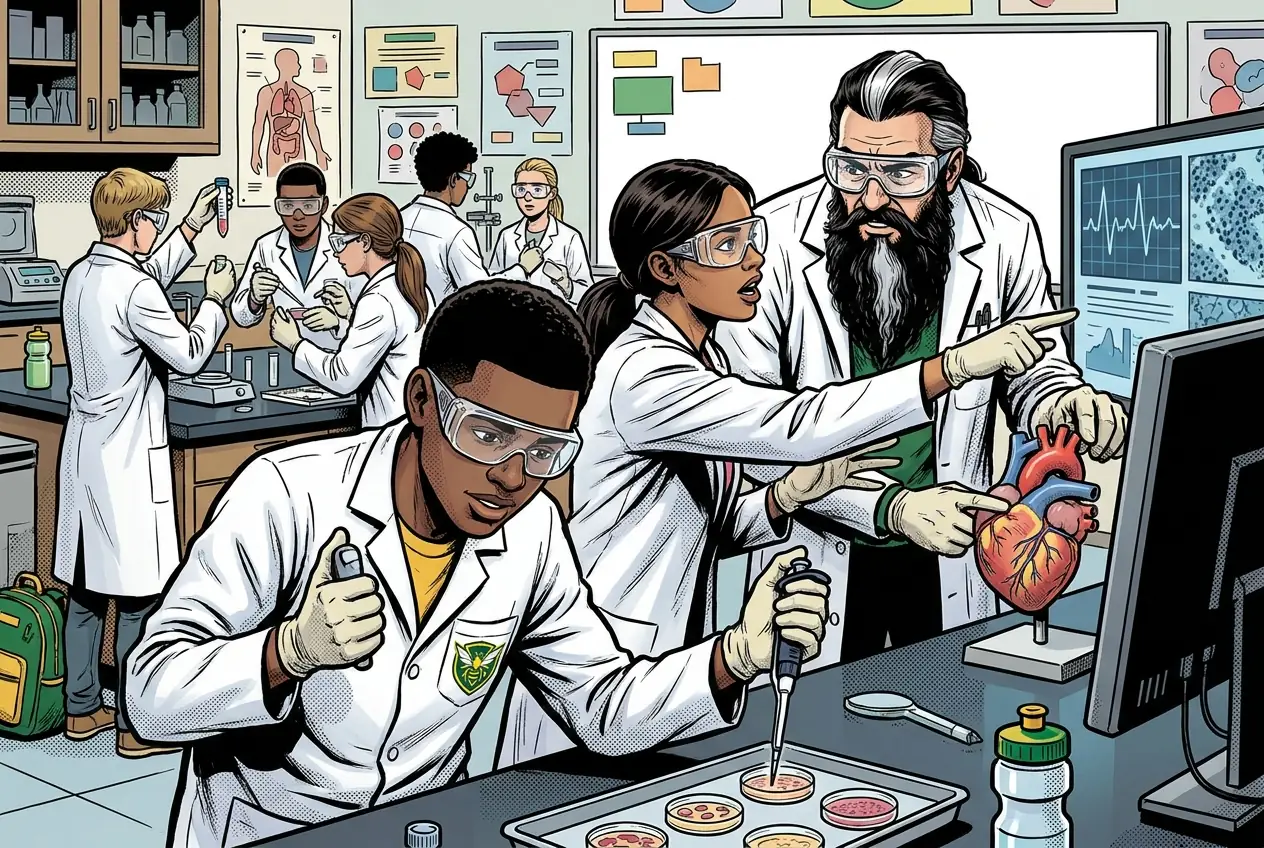
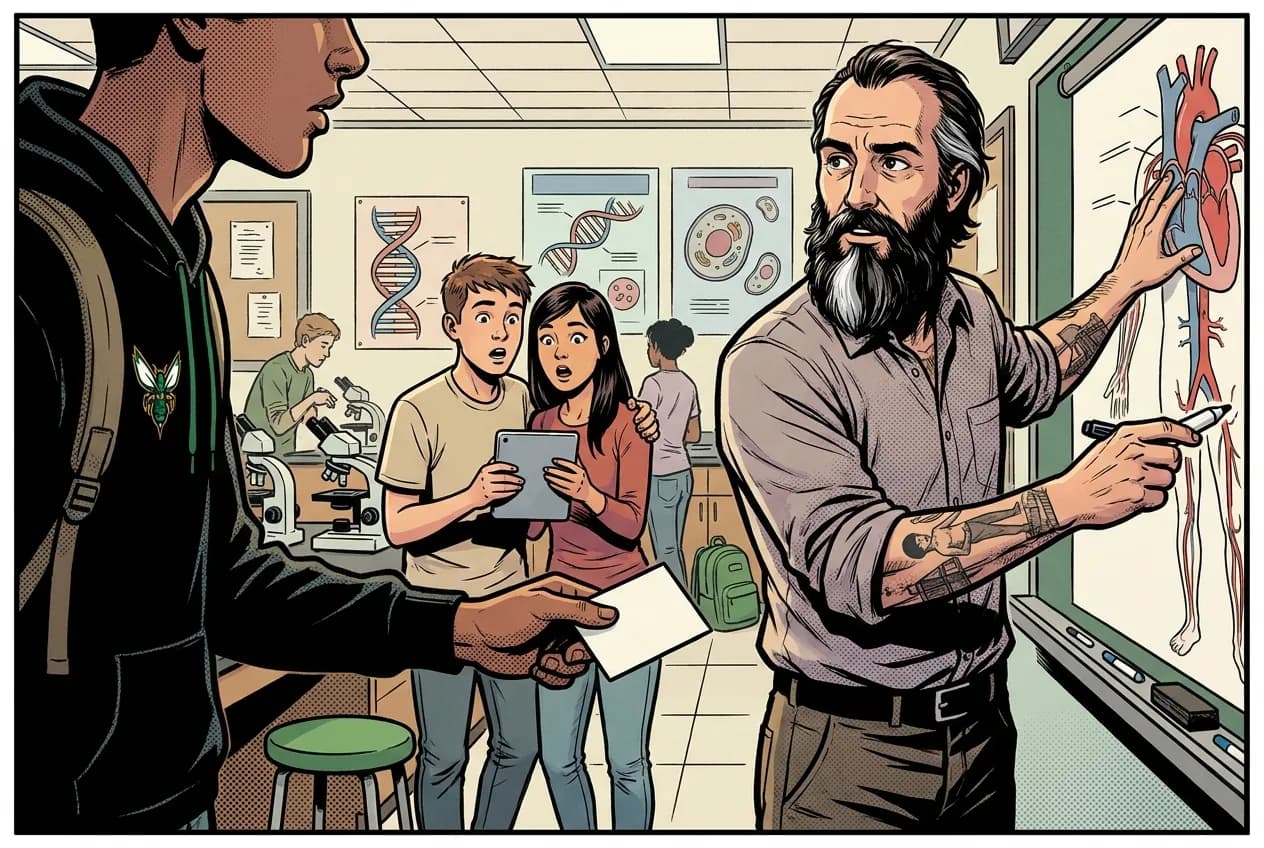
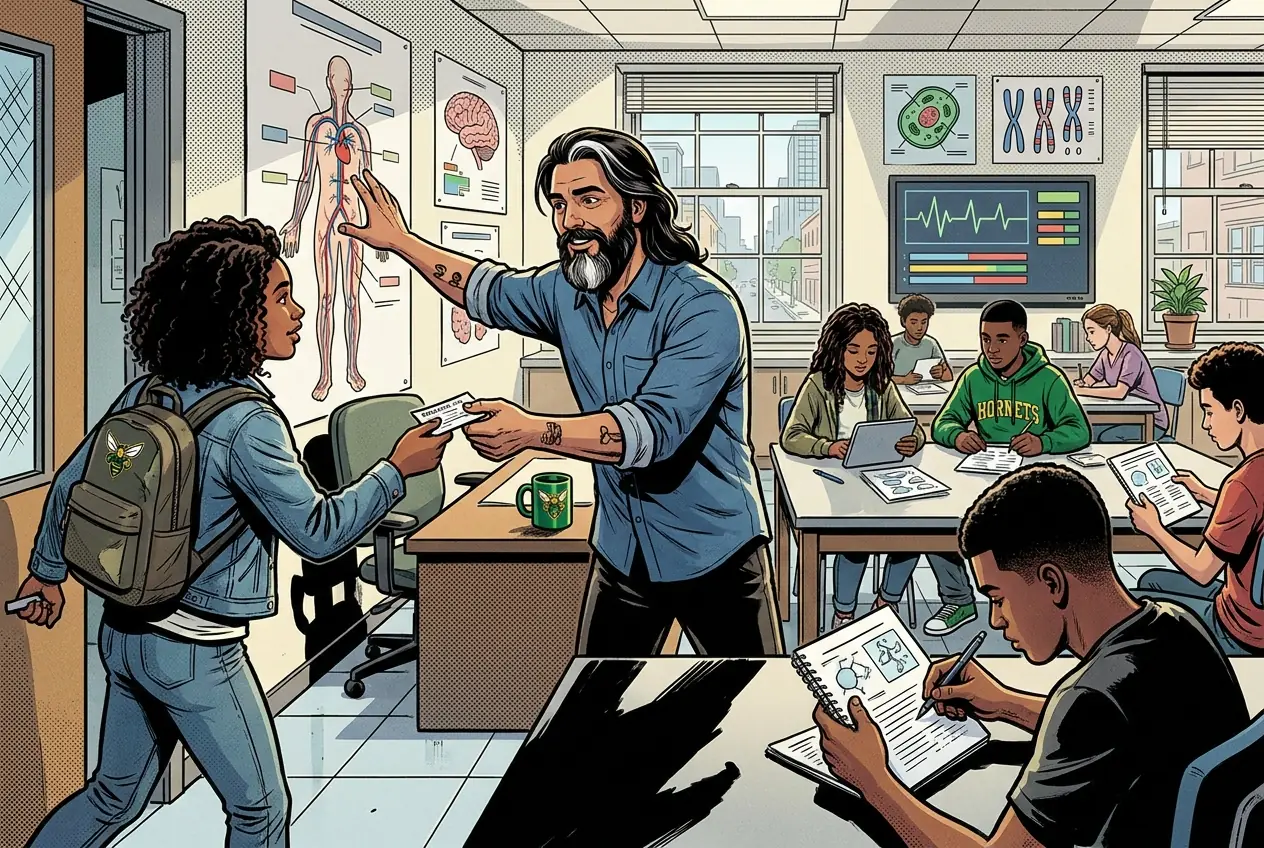
Fiction. There is no such student. The lessons, labs and dates are the real planned course; the student, the classmates and the conversations are invented.
What to do when absent
Most days, this class is your PLTW coursework: and PLTW is online and individual. So being out usually just means doing exactly what we did in class, from home.
Open Clever, then myPLTWHow to get there: open Clever and sign in with your Microsoft (district) account. Both myPLTW and Schoology are in Clever. Do the activity in myPLTW. Turn the work in on this site or hand it to Mr. Mendoza, because that is the step that counts as submitted. Schoology only shows your report-card grade later.
You can't do those from home: do this instead: Recorded walkthrough and study critique.
Class still runs. A substitute will post today's plan: complete the online activity above; it's built to be self-guided. Need the concept taught without a teacher? Use this authoritative explainer:
Khan Academy Scientific MethodVocabulary
Virtual resources
Teacher-posted resources
Classroom documents for this lesson are posted in Schoology. Open Clever, then Schoology, and find each one by the name shown on its card.
Use this if you were absent, got stuck, or need another pass before you submit the lesson artifact.
Placement rationale
Matched ER presentation and physiology bridge by path:Biomedical-Innovations/Problem-1_Emergency-Room/1.1_Emergency-Room; keywords:emergency room, clinical. Score 142. Visibility: student-schoology (student-facing resource; link through Schoology rather than local path).
Open this when the class reaches this activity and use it to complete the required lesson artifact.
Placement rationale
Matched ER presentation and physiology bridge by path:Biomedical-Innovations/Problem-2_Human-Physiology/2.1_Human-Physiology; keywords:physiology. Score 134. Visibility: student-schoology (student-facing resource; link through Schoology rather than local path).
How to get there: open Clever and sign in with your Microsoft (district) account. Both myPLTW and Schoology are in Clever. Do the activity in myPLTW. Turn the work in on this site or hand it to Mr. Mendoza, because that is the step that counts as submitted. Schoology only shows your report-card grade later.