

Literature and design analysis
Do now
Students will evaluate their research design against published literature and refine weak points.
- Hand in
- Literature comparison summary: one credible source cited, one strength and one weakness of the team design identified, one concrete revision documented.
- Where
- Turn this in at the drop folder with your district Microsoft sign-in, or hand it to Mr. Mendoza in class. Both count as submitted. Doing the activity in myPLTW does not.
You get two school days for every day you were absent, so this deadline moves with you.
When you hold your worm experiment next to a published study, which of your controls or your turns out to be too weak to trust?
Students will evaluate their research design against published literature and refine weak points.
- • Design is compared to at least one credible source.
- • Summary names one concrete revision made.
- Name one place you would look for a credible source: a peer-reviewed journal, a random blog, or a social media post? Explain in one line.
- Why is revising your design after reading a study a sign of good science, not bad planning?
- 1Locate one credible source related to your question.
- 2Compare your methods to the published approach.
- 3Identify one strength and one weakness in your design.
- 4Revise your variables or if needed.
- 5Summarize how the literature improved your plan.
What did this day actually feel like?
Literature and design analysis
Find a credible source, name one strength and one weakness of our design against it. Reading a real paper is hard. I understood maybe half and the half I understood was enough to see that our sample size was optimistic.
AT HOME, THE WEEKEND BEFORE TUE APR 13 Submit design evidence Variables diagram, design plan, literature summary, tracker.
Turned in: design packet → recorded in Class Records
Fiction. There is no such student. The lessons, labs and dates are the real planned course; the student, the classmates and the conversations are invented.
The same day, drawn.
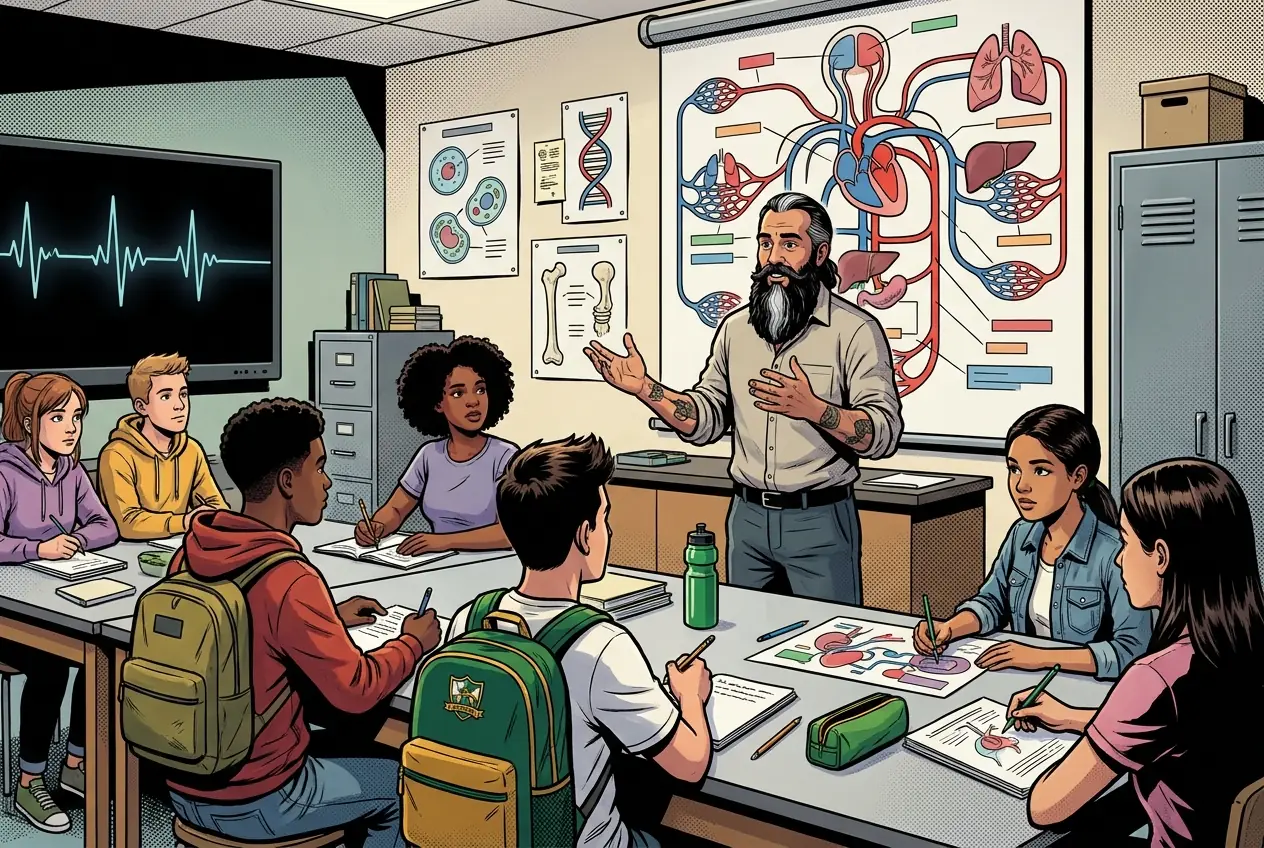
Find a credible source, name one strength and one weakness of our design against it. Reading a real paper is hard.
Fiction. There is no such student. The lessons, labs and dates are the real planned course; the student, the classmates and the conversations are invented.
🛠 Get unstuck · pick your level
🔑 Today's words · 5
Tap a word in the lesson for a plain meaning and one example. Recycled into next week's Do-Now.
Do the work · 80-minute blockfirst 5 min = hook▸
💡 Big idea: Scientists compare their designs to published literature, so that they catch weak controls and small samples through others' work instead of through failed data.
- 0-10Mini-lesson: how to evaluate source credibility (CRAAP or similar framework)
- 10-28Teams locate one credible source; record title, author, and key methods
- 28-45Compare team methods to the published approach; note similarities and differences
- 45-58Identify one design strength and one weakness; decide on one revision
- 58-70Revise the design plan (variables or ) and document the change
- 70-80Write summary of how the literature improved your plan; submit
- • No scientist designs an experiment without first reading what has already been done.
- • Today you will locate a credible source and use it to stress-test your team's design.
- • Finding one weakness and fixing it now is far better than discovering it after you collect data.
- • You will document your revision so your poster can describe your design evolution.
- • Credible scientific sources include peer-reviewed journals, government health databases, and vetted educational institutions.
- • Comparing your design to published methods reveals gaps in controls, , or measurement.
- • Iterative revision is a normal and necessary part of the scientific process.
Unit 2.2 Research Model: Model organisms, C. elegans, neurotransmitters/hormones, scientific literature, research poster. · Literature and design analysis
Day 4 of this lesson. Open this exact section in myPLTW (find it in Clever, Microsoft sign-in), then do the work below.
Do this: Complete the literature-review or design-analysis prompt in myPLTW associated with today's source-comparison work; finish it after you document your design revision.
Mark the literature-analysis activity complete in myPLTW after submitting your literature comparison summary.
Design task is done; today the literature task should show complete and your revised plan should be submitted.
Screenshot or note of completion status for your tracker.
The official PLTW activity stays inside myPLTW. If myPLTW will not open, use F1 and E1-E3 on this page to complete today's local evidence decision, then make up the official activity when access returns. Turn this in at the drop folder with your district Microsoft sign-in, or hand it to Mr. Mendoza in class. Both count as submitted. Doing the activity in myPLTW does not.
Check things off as you work, then submit. This tells Mr. Mendoza how you're doing so he can help the class. It does not replace turning in your producible through the submission route shown below.
Use the code Mr. Mendoza gave you, not your name. Saved on this device.
Unit 2.2 Research Model: Model organisms, C. elegans, neurotransmitters/hormones, scientific literature, research poster. · Literature and design analysis
Complete the literature-review or design-analysis prompt in myPLTW associated with today's source-comparison work; finish it after you document your design revision.
Design task is done; today the literature task should show complete and your revised plan should be submitted.
This is how Mr. Mendoza sees the class keeping pace with PLTW. Be honest, it only helps if it is accurate.
🎯 Students will evaluate their research design against published literature and refine weak points.
- Locate one credible source related to your question.
- Compare your methods to the published approach.
- Identify one strength and one weakness in your design.
- Revise your variables or if needed.
- Summarize how the literature improved your plan.
Notebook check: Literature comparison summary: one credible source cited, one strength and one weakness of the team design identified, one concrete revision documented.
Turn this in at the drop folder with your district Microsoft sign-in, or hand it to Mr. Mendoza in class. Both count as submitted. Doing the activity in myPLTW does not. Use the checklist just below and upload by 11:29 PM for full credit. Absent with an excused absence? You get two school days for every day you were absent, so this deadline moves with you.
| Task | Who |
|---|---|
| Locate one credible source related to your question. | _______ |
| Compare your methods to the published approach. | _______ |
| Identify one strength and one weakness in your design. | _______ |
| Revise your variables or if needed. | _______ |
| Summarize how the literature improved your plan. | _______ |
Working solo? Put your own name in "Who" for every row.
- Design is compared to at least one credible source.
- Summary names one concrete revision made.
- 1Do thisStudents will evaluate their research design against published literature and refine weak points.
- 2Use this resource
- 3Submit thisNotebook check: Literature comparison summary: one credible source cited, one strength and one weakness of the team design identified, one concrete revision documented.
- 4Submit it here
- 1Open the drop folder.
- 2Sign in with your district Microsoft account, not a personal one.
- 3Upload the file, named Lastname_Firstname__Assignment Title.
- 4Your own upload panel says Uploaded with a green check: that is your receipt.
Turn this in at the drop folder with your district Microsoft sign-in, or hand it to Mr. Mendoza in class. Both count as submitted. Doing the activity in myPLTW does not. Human Anatomy & Physiology (Human Body Systems) › Unit 2.2 Research Model: Model organisms, C. elegans, neurotransmitters/hormones, scientific literature, research poster. › Notebook checkOpen the drop folder
Learn it · deck, reading, and vocabulary▸
The deck carries the prior idea forward, lets you inspect an analogy, maps the rule to biology, and ends with the same evidence decision and exit ticket used on this page.
Generated from this lesson's canonical data with a red-team citation check.
A testable question names the organism, variable, and outcome, so that the entire investigation produces data other scientists can interpret and compare.
Scientists compare their designs to published literature, so that they catch weak controls and small samples through others' work instead of through failed data.
A bridge prototype is tested against a load limit, cost limit, and user need before revision.
- Which requirement is a criterion?
- Which limit is a constraint?
- What test result should trigger a redesign?
A design improves when evidence is compared with explicit criteria and constraints.
Biomedical designs also require , ethics, and biological validation beyond a physical prototype test.
- • Bridge requirements map to design criteria.
- • Load results map to E1-E3.
- • Revision maps to the next evidence-based iteration.
Driving question: When you hold your worm experiment next to a published study, which of your controls or your turns out to be too weak to trust?
What you already know: A testable question names the organism, variable, and outcome, so that the entire investigation produces data other scientists can interpret and compare.
New idea: Scientists compare their designs to published literature, so that they catch weak controls and small samples through others' work instead of through failed data.
Visual or model: F1. F1. A lesson illustration or teaching diagram for Literature and design analysis. Use it with E1-E3; it is a model or context image, not experimental or patient data. What to notice: Trace the labeled structure, movement, or system relationship that connects form to function.
- Observe or measure the relevant feature in Literature and design analysis.
- Organize the observation with a stable evidence ID.
- Apply this rule: A design improves when evidence is compared with explicit criteria and constraints.
- Choose the option the evidence supports and state the limit of the conclusion.
Real biomedical example: When you hold your worm experiment next to a published study, which of your controls or your turns out to be too weak to trust?
What the evidence supports: E1-E3 and F1 support the daily take-home when the response meets the stated success criteria.
What it cannot prove: The package does not support claims beyond this lesson's or any real patient diagnosis.
- • : A species, such as zebrafish or mouse, studied because its biology is similar enough to ours to teach us about human development and disease.
- • C. elegans: Use the lesson context and glossary entry to explain C. elegans in your own words.
- • : A that measures the presence, amount, or activity of a target substance such as a , , or chemical in a sample.
- • literature: The body of published research articles and reports on a topic that scientists read to learn what is already known before doing new work.
- • variable: Any factor in an experiment that can change or be changed, including what you test, what you measure, and what you hold steady.
- • control: The comparison condition that isolates the effect of the variable being tested by keeping everything else the same.
- • : The number of subjects or observations in a study; larger samples give more reliable results and reduce the role of chance.
Use it now: Choose one decision option. Cite E1 and E3, then explain how the rule connects the evidence to your choice.
Go further, optional: The source links below are optional enrichment. Every fact required for today's local evidence decision appears in this lesson package.
Credible scientific sources include peer-reviewed journals, government health databases, and vetted educational institutions.
Limit: E1 supplies context or an observation; it does not by itself establish the explanation.
Scientists compare their designs to published literature, so that they catch weak controls and small samples through others' work instead of through failed data.
Limit: E2 is a teaching statement or comparison and must be checked against the task evidence.
Design is compared to at least one credible source.
Limit: E3 supports only the result or product criterion named here; it cannot justify a broader clinical or causal claim.
PLTW-HAP-2027-04-12 · Simulated classroom evidence scenario
Your role: anatomy and physiology consultant
Decision: Your team must decide what the evidence from Literature and design analysis supports before submitting the notebook record named on the lesson page.
- • Keep the current design.
- • Revise the feature that misses a criterion.
- • Run one more fair test before choosing.
Response: State one choice, cite at least two evidence IDs, explain the rule that connects them, and add one limitation. Submit it as the notebook record.
Claim ceiling: The supplied lesson evidence can support an observation, pattern, classroom mechanism, or next-step decision about Literature and design analysis. It cannot by itself prove causation, establish a real clinical diagnosis, or justify action outside this classroom task.
Mean = sum of values / number of values. Median = middle ordered value. Range = maximum - minimum.
For 2, 4, 4, and 10: mean = 20 / 4 = 5, median = 4, and range = 10 - 2 = 8.
Mean, median, and range keep the measurement unit. Order the values before finding the median.
Calculate the requested summary for today's supplied values, then write what it reveals and what it hides.
- • The solution must address the stated need in Literature and design analysis.
- • The decision must be supported by E1-E3.
- • The final product must make the success criteria visible.
- • Complete the work inside the 80-minute block.
- • Use only supplied or teacher-approved materials and evidence.
- • Do not trade , accessibility, or privacy for speed.
- • and evidence quality: must pass before scoring other criteria.
- • User need and effectiveness: highest scored criterion.
- • Time, cost, and ease of use: compare only after and effectiveness pass.
Test evidence: For each option, record the E1-E3 result that supports or fails each criterion. Do not assign a score without a named observation.
- Version or option tested
- Criterion met or missed
- Evidence ID and result
- Revision made
- Reason for the revision
- Need and user
- Criteria and constraints
- Chosen option and evidence
- Test result
- Revision and reason
Students often think Students often think that once a design is written, changing it means they made a mistake or wasted time.. The trap: That belief keeps weak designs alive. Iterative revision is the normal engine of science: comparing to published methods and then fixing your controls or is exactly what professional researchers do before they ever collect data.
Credible source cited: a peer-reviewed study on copper toxicity in C. elegans (from a science journal database).
Comparison to our design:
- Strength of our design: we control temperature, food, and worm age, which matches the careful controls the published study used.
- Weakness of our design: the published study used about 30 worms per group, while we planned only 10, so our sample size was smaller and less reliable.
Concrete revision made: we increased our target sample size from 10 to 30 worms per concentration to improve reliability and make our results more comparable to published work.
How the literature improved our plan: reading the published methods showed us that our controls were solid but our sample size was too small, so the revision strengthens the part most likely to weaken our conclusions.
This model shows the level of evidence and organization needed to complete: A literature comparison summary citing one credible source, identifying one strength and one weakness of the team design, and documenting one concrete revision.
- Date and label the entry.
- Record the procedure, observation, or design decision clearly.
- End with what the evidence means and the next step.
Keep the structure. Replace the question, facts, measurements, and evidence. Then recheck units, vocabulary, and whether the conclusion goes beyond the evidence.
Also due today: Submit your literature comparison on the class site, or hand it to Mr. Mendoza in class.
- CER:
- Claim, Evidence, Reasoning: make a claim, back it with evidence, explain your reasoning.
- SOP:
- Standard Operating Procedure, the exact steps to follow (especially in a lab).
- Tracker:
- Your PLTW progress log where you record completed evidence.
- myPLTW:
- The PLTW course site where you do the online activities. Find it in Clever with your Microsoft sign-in, right next to Schoology.
Tap the speaker to hear a term. Add two of these to your notebook glossary with a definition and an example in your own words.
Pick just 2 or 3 words from today and make them yours: write what each one means in your own words, name the context clue or evidence that helped, then give one example from what you actually did in Literature and design analysis. Try your own words first; the glossary is there if you get stuck. This is voluntary and counts as extra credit, so keep it short.
Saved on this device. Show Mr. Mendoza or add these to your notebook glossary to claim the extra credit.
Hand-picked readings, videos, and interactives for this lesson, all free and from authoritative open organizations (NIH, CDC, OpenStax, Khan Academy, PhET, HHMI, and more).
A fillable, Cornell-style notebook for Unit 2: Research Ready. Type your notes, cues, and summaries right in the PDF, or print it and write by hand. Each lesson page has a cue column, a notes column, and a summary box, plus dated lab-record pages you can turn in.
HBS Unit 2 notebook: Research Ready Fillable PDFCornell notes + lab recordsOpenVetted readings and references for this unit. Use them to prepare, to catch up if you were absent, or to go deeper on today's target.
This site may ask you to verify you are human. If it blocks you on a school device, ask for the class copy.
Check yourself · commit, then reveal▸
Claim ceiling for this check: The supplied lesson evidence can support an observation, pattern, classroom mechanism, or next-step decision about Literature and design analysis. It cannot by itself prove causation, establish a real clinical diagnosis, or justify action outside this classroom task.
Which of these is a credible scientific source for your worm study, and why: (a) a peer-reviewed journal article, (b) an anonymous forum post, (c) a company selling worm food?
Write an answer and pick a confidence to unlock the key.
Fast retrieval with instant answers, not the commit-then-reveal check above. Try each from memory first: write what you remember about the earlier units, then check yourself here.
Go further and get help▸
What today's skills lead to. These are real health-science careers this course builds toward. Tap one to see, on the US Department of Labor's O*NET site, what the job actually involves, what it pays, and how fast it is growing.
Why zebrafish and mice model human development, and the Atit lab's work.
Goes with: Why zebrafish and mice: animal models and the Atit lab
Use to see how IRF6's 3D shape lets it do its job.
Goes with: AlphaFold and UniProt: structure tells function
Message your group for what they decided and why, then write your own contribution: your position, your evidence, and where you disagree.
Back in class. If you cannot reach your group, tell Mr. Mendoza and he will place you before the next working session.
Class still runs. Complete the online activity above (it's self-guided). Need the concept taught without a teacher? Use this authoritative explainer:
Khan Academy: The science of biology (experimental design)You've passed Unit 2, so the optional extra-credit track is open. Complete reserved-unit work from home, including virtual labs, for extra credit. Each item shows its correct submission route.
Open the extra-credit track- CompleteEvery required part of the artifact is present, nothing left blank.
- AccurateThe science and the data are correct and match the evidence.
- Scientific reasoningYou explain your claim with evidence and reasoning (CER), not just an answer.
- Professional communicationClear, organized, labeled, and written the way a clinician or scientist would.
- SubmittedTurned in the right way, on the class site or handed to Mr. Mendoza in class, and confirmed. Not in Schoology: that is where the report-card grade appears later.