

Environmental justice debate
Do now
Argue who bears responsibility when a low-income neighborhood faces higher pollutant exposure than wealthier areas nearby.
- Hand in
- One-sentence evidence-based statement on who bears responsibility for unequal pollutant exposure and why.
- Where
- Turn this in at the drop folder with your district Microsoft sign-in, or hand it to Mr. Mendoza in class. Both count as submitted. Doing the activity in myPLTW does not.
You get two school days for every day you were absent, so this deadline moves with you.
Two Cleveland neighborhoods sit half a mile apart, but one shows higher measured pollutant exposure than the other, so who owes the residents an answer, and what does the data actually prove?
Argue who bears responsibility when a low-income neighborhood faces higher pollutant exposure than wealthier areas nearby.
- • You defended a stakeholder position using exposure evidence.
- • You explained how environmental burdens can be unequally distributed.
- Name one thing in or near a neighborhood that could raise the amount of pollution people there breathe or drink.
- If two nearby neighborhoods have different pollution levels, write one reason that gap might exist.
- 1Read the briefing comparing exposure data across two adjacent neighborhoods.
- 2Choose a stakeholder role such as resident, industry, or regulator.
- 3List two reasons your stakeholder's position is fair.
- 4Debate in your group, tracking which claims used exposure data.
- 5Reflect on how data should guide responsibility decisions.
What did this day actually feel like?
Environmental justice debate
ETHICS DAY Why exposure is not evenly distributed, and whether that is an accident of geography or the result of decisions.
This is not abstract in Cleveland and everybody knew it. Quietest and most serious Monday so far.
AT HOME, THE NIGHT BEFORE THU APR 8 Exposure pathway Source, pathway, receptor. You can break the chain at any of the three, and which one you choose is a policy decision disguised as a technical one.
Telling people to stay indoors breaks it at the receptor and leaves the source running.
Turned in: notebook → Lab Notebooks folder
Fiction. There is no such student. The lessons, labs and dates are the real planned course; the student, the classmates and the conversations are invented.
The same day, drawn.
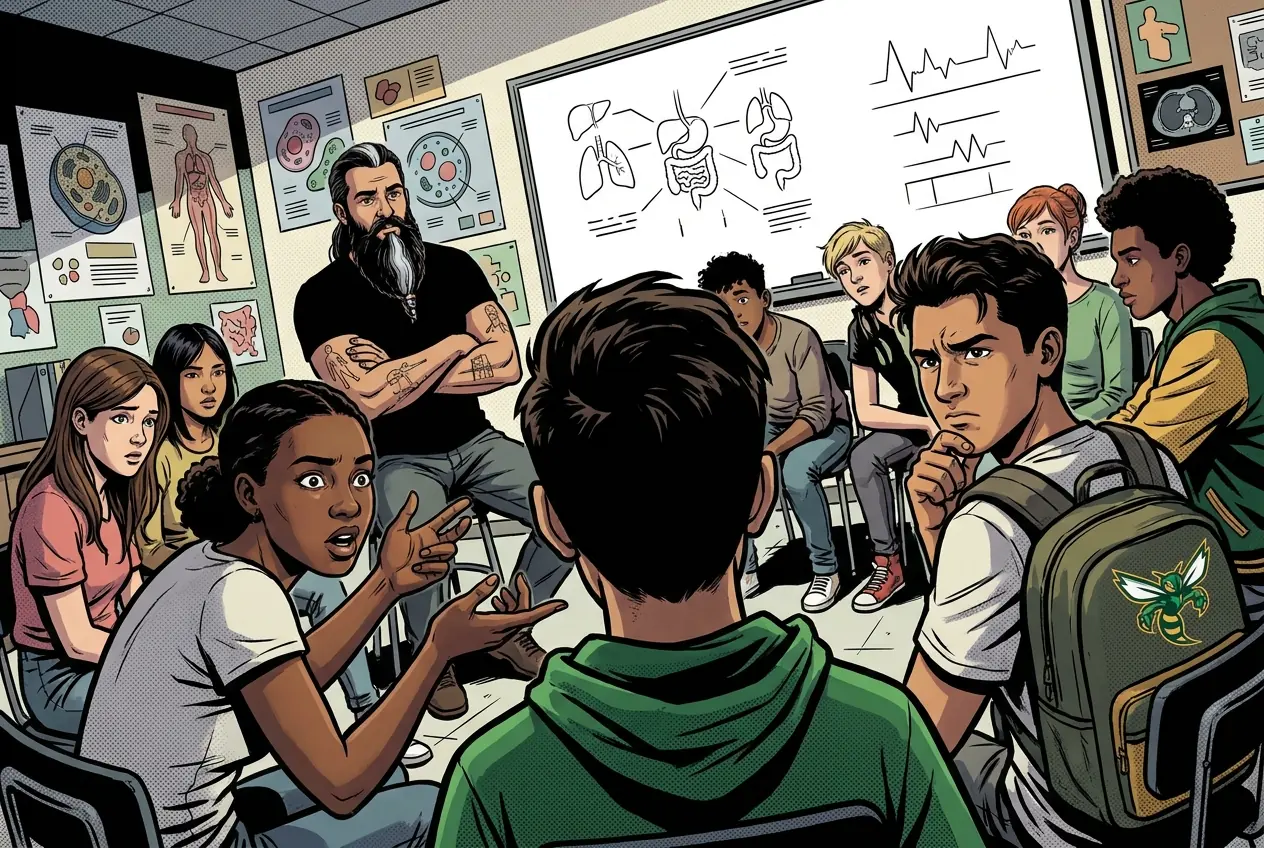
Why exposure is not evenly distributed, and whether that is an accident of geography or the result of decisions.
Fiction. There is no such student. The lessons, labs and dates are the real planned course; the student, the classmates and the conversations are invented.
🛠 Get unstuck · pick your level
🔑 Today's words · 5
Tap a word in the lesson for a plain meaning and one example. Recycled into next week's Do-Now.
Do the work · 80-minute blockfirst 5 min = hook▸
💡 Big idea: Pollution sources were sited by past decisions, so environmental health burdens fall harder on lower-income and marginalized neighborhoods, and exposure data reveals that uneven pattern.
- 0-5 minWarm-up: name one way where you live might affect your health
- 5-20 minRead briefing; choose stakeholder role and list two reasons your position is fair
- 20-40 minSmall-group debate tracking which claims cite exposure data
- 40-55 minFull-class debrief: which stakeholder argument was hardest to refute?
- 55-70 minReflection: how should data change who pays for exposure reduction?
- 70-80 minExit ticket: one sentence on what counts as fair based on the data
- • Environmental justice asks: does everyone face the same health risk from pollution?
- • Today we look at exposure data for two neighborhoods side by side and ask who is responsible.
- • You'll argue from a specific stakeholder's point of view: resident, company, or regulator.
- • Good arguments use the actual numbers, not just feelings about fairness.
- • Exposure data can show whether pollution risk varies by neighborhood income or race.
- • Stakeholder roles shape how people interpret the same exposure numbers.
- • decisions require evidence, not just opinion.
Exposure pathways, toxins, dose, pollutants, public health risk. · Environmental justice debate
Day 1 of this lesson. Open this exact section in myPLTW (find it in Clever, Microsoft sign-in), then do the work below.
Do this: Open Problem 4 Investigating Environmental Health in your myPLTW course shell and navigate to the environmental justice discussion activity.
Check off the environmental justice discussion milestone in your activity tracker after submitting your reflection.
You are starting Problem 4 on schedule; by end of today your reflection on data-driven responsibility should be submitted.
Reflection paragraph attached as evidence of the discussion milestone.
The official PLTW activity stays inside myPLTW. If myPLTW will not open, use F1 and E1-E3 on this page to complete today's local evidence decision, then make up the official activity when access returns. Turn this in at the drop folder with your district Microsoft sign-in, or hand it to Mr. Mendoza in class. Both count as submitted. Doing the activity in myPLTW does not.
Check things off as you work, then submit. This tells Mr. Mendoza how you're doing so he can help the class. It does not replace turning in your producible through the submission route shown below.
Use the code Mr. Mendoza gave you, not your name. Saved on this device.
Exposure pathways, toxins, dose, pollutants, public health risk. · Environmental justice debate
Open Problem 4 Investigating Environmental Health in your myPLTW course shell and navigate to the environmental justice discussion activity.
You are starting Problem 4 on schedule; by end of today your reflection on data-driven responsibility should be submitted.
This is how Mr. Mendoza sees the class keeping pace with PLTW. Be honest, it only helps if it is accurate.
🎯 Argue who bears responsibility when a low-income neighborhood faces higher pollutant exposure than wealthier areas nearby.
- Read the briefing comparing exposure data across two adjacent neighborhoods.
- Choose a stakeholder role such as resident, industry, or regulator.
- List two reasons your stakeholder's position is fair.
- Debate in your group, tracking which claims used exposure data.
- Reflect on how data should guide responsibility decisions.
Exit ticket: One-sentence evidence-based statement on who bears responsibility for unequal pollutant exposure and why.
Turn this in at the drop folder with your district Microsoft sign-in, or hand it to Mr. Mendoza in class. Both count as submitted. Doing the activity in myPLTW does not. Use the checklist just below and upload by 11:29 PM for full credit. Absent with an excused absence? You get two school days for every day you were absent, so this deadline moves with you.
| Task | Who |
|---|---|
| Read the briefing comparing exposure data across two adjacent neighborhoods. | _______ |
| Choose a stakeholder role such as resident, industry, or regulator. | _______ |
| List two reasons your stakeholder's position is fair. | _______ |
| Debate in your group, tracking which claims used exposure data. | _______ |
| Reflect on how data should guide responsibility decisions. | _______ |
Working solo? Put your own name in "Who" for every row.
- You defended a stakeholder position using exposure evidence.
- You explained how environmental burdens can be unequally distributed.
- 1Do thisArgue who bears responsibility when a low-income neighborhood faces higher pollutant exposure than wealthier areas nearby.
- 2Use this resource
- 3Submit thisExit ticket: One-sentence evidence-based statement on who bears responsibility for unequal pollutant exposure and why.
- 4Submit it here
- 1Open the drop folder.
- 2Sign in with your district Microsoft account, not a personal one.
- 3Upload the file, named Lastname_Firstname__Assignment Title.
- 4Your own upload panel says Uploaded with a green check: that is your receipt.
Turn this in at the drop folder with your district Microsoft sign-in, or hand it to Mr. Mendoza in class. Both count as submitted. Doing the activity in myPLTW does not. Biotechnology for Health (Biomedical Innovations) › Exposure pathways, toxins, dose, pollutants, public health risk. › Exit ticketOpen the drop folder
Learn it · deck, reading, and vocabulary▸
The deck carries the prior idea forward, lets you inspect an analogy, maps the rule to biology, and ends with the same evidence decision and exit ticket used on this page.
Generated from this lesson's canonical data with a red-team citation check.
You define a metric with units, a control, and a pass/fail line so that a result can be traced to the prototype rather than to chance or wishful thinking.
Pollution sources were sited by past decisions, so environmental health burdens fall harder on lower-income and marginalized neighborhoods, and exposure data reveals that uneven pattern.
A bridge prototype is tested against a load limit, cost limit, and user need before revision.
- Which requirement is a criterion?
- Which limit is a constraint?
- What test result should trigger a redesign?
A design improves when evidence is compared with explicit criteria and constraints.
Biomedical designs also require , ethics, and biological validation beyond a physical prototype test.
- • Bridge requirements map to design criteria.
- • Load results map to E1-E3.
- • Revision maps to the next evidence-based iteration.
Driving question: Two Cleveland neighborhoods sit half a mile apart, but one shows higher measured pollutant exposure than the other, so who owes the residents an answer, and what does the data actually prove?
What you already know: You define a metric with units, a control, and a pass/fail line so that a result can be traced to the prototype rather than to chance or wishful thinking.
New idea: Pollution sources were sited by past decisions, so environmental health burdens fall harder on lower-income and marginalized neighborhoods, and exposure data reveals that uneven pattern.
Visual or model: F1. F1. A lesson illustration or teaching diagram for Environmental justice debate. Use it with E1-E3; it is a model or context image, not experimental or patient data. What to notice: Trace the labeled system, test, or design relationship and identify which evidence should trigger revision.
- Observe or measure the relevant feature in Environmental justice debate.
- Organize the observation with a stable evidence ID.
- Apply this rule: A design improves when evidence is compared with explicit criteria and constraints.
- Choose the option the evidence supports and state the limit of the conclusion.
Real biomedical example: Environmental-health teams graph exposure measurements by place or time to identify a pattern that should be investigated, while keeping correlation separate from causation. Source: NIST Statistics Resources.
What the evidence supports: E1-E3 and F1 support the daily take-home when the response meets the stated success criteria.
What it cannot prove: The package does not support claims beyond this lesson's or any real patient diagnosis.
- • : A poisonous substance produced by a living organism, such as bacteria, plants, or animals, that can damage cells or disrupt body functions.
- • exposure: Contact with a substance, agent, or condition that could affect health, such as a chemical, , or environmental factor.
- • dose: The measured amount of a drug or substance given at one time, chosen to be effective while staying safe for the patient.
- • pollutant: A harmful substance released into air, water, or soil that can damage ecosystems and human health.
- • : The gradual buildup of a substance, such as a , inside an organism faster than the body can break it down or remove it.
- • risk: The chance that a harmful event, such as getting a disease, will happen within a given group or time period.
Use it now: Choose one decision option. Cite E1 and E3, then explain how the rule connects the evidence to your choice.
Go further, optional: The source links below are optional enrichment. Every fact required for today's local evidence decision appears in this lesson package.
Exposure data can show whether pollution risk varies by neighborhood income or race.
Limit: E1 supplies context or an observation; it does not by itself establish the explanation.
Pollution sources were sited by past decisions, so environmental health burdens fall harder on lower-income and marginalized neighborhoods, and exposure data reveals that uneven pattern.
Limit: E2 is a teaching statement or comparison and must be checked against the task evidence.
You defended a stakeholder position using exposure evidence.
Limit: E3 supports only the result or product criterion named here; it cannot justify a broader clinical or causal claim.
PLTW-BFH-2027-04-07 · Simulated classroom evidence scenario
Your role: biomedical design team member
Decision: Your team must decide what the evidence from Environmental justice debate supports before submitting the exit response named on the lesson page.
- • Select the option best supported by E1-E3.
- • Select a reasonable alternative and name the evidence it would require.
- • Delay the claim because the evidence does not distinguish the options.
Response: State one choice, cite at least two evidence IDs, explain the rule that connects them, and add one limitation. Submit it as the exit response.
Claim ceiling: The supplied lesson evidence can support an observation, pattern, classroom mechanism, or next-step decision about Environmental justice debate. It cannot by itself prove causation, establish a real clinical diagnosis, or justify action outside this classroom task.
Rate or percent = part / comparison total x 100%. Percent change = (new - comparison) / comparison x 100%.
If 18 of 60 records meet a condition, the frequency is 18 / 60 x 100% = 30%.
Name the comparison total. A percent describes the supplied group and does not automatically predict an individual's outcome.
Use today's supplied counts to calculate one rate, risk, frequency, or percent change. Show the denominator and interpretation.
Students often think Students often assume that if pollution is worse in a poorer neighborhood, it is because the people there did something (littered, did not maintain their homes) to cause it.. The trap: That flips cause and effect. Exposure gaps usually trace to decisions made long before residents arrived, like where highways, factories, and waste sites were zoned, so blaming residents hides the actual source and lets the real decision-makers off the hook.
Parallel case (not today's prompt): An older apartment building draws its tap water through lead service lines installed decades ago, while a newer building across the street was plumbed with copper. Water testing shows the older building has a much higher lead level at the tap. Who bears responsibility for the residents' exposure, and what does the data actually prove?\n\nClaim: Because the older building's tap water carries lead well above the level considered safe while the newer building's water does not, the utility that owns the service lines and the property owner who left them in place share responsibility for reducing the exposure, since the data shows the risk comes from the pipes, not from anything the residents did.\n\nEvidence: The water samples show the older building averaged roughly 20 parts per billion of lead at the tap, above the 15 parts per billion action level, while the newer building measured near zero. Both buildings receive water from the same treatment plant and the same source, so the treated water entering each building started out the same. The only measured difference between the two water paths is the metal in the pipes, lead in the older lines and copper in the newer ones.\n\nReasoning: Lead does not appear in water on its own, it dissolves into the water as it sits in contact with lead pipes, so a higher reading at the tap points to the plumbing the water traveled through rather than to the residents' habits or choices. Because both buildings share the same source and treatment, that shared starting point rules out the treatment plant as the cause and isolates the service lines as the variable that changed the outcome. The residents cannot see, choose, or replace the buried lines they rent water through, so the burden of an exposure they did not create falls on the parties who control those lines, the utility that owns them and the owner responsible for the building's plumbing. The data proves where the lead is coming from, and that source is on the responsible parties' side of the tap.
This model shows the level of evidence and organization needed to complete: Parallel-case model for the Problem 4 environmental-justice discussion: it demonstrates the Claim, Evidence, Reasoning format and depth on a different exposure scenario (lead in tap water) so students can transfer the structure to their own one-sentence position without seeing today's answer.
- Name the prompt or task.
- Answer it directly with the key evidence.
- Check that the response matches the requested format.
Keep the structure. Replace the question, facts, measurements, and evidence. Then recheck units, vocabulary, and whether the conclusion goes beyond the evidence.
Also due today: Submit your exit ticket on the class site before leaving class.
- CER:
- Claim, Evidence, Reasoning: make a claim, back it with evidence, explain your reasoning.
- SOP:
- Standard Operating Procedure, the exact steps to follow (especially in a lab).
- Tracker:
- Your PLTW progress log where you record completed evidence.
- myPLTW:
- The PLTW course site where you do the online activities. Find it in Clever with your Microsoft sign-in, right next to Schoology.
Tap the speaker to hear a term. Add two of these to your notebook glossary with a definition and an example in your own words.
Pick just 2 or 3 words from today and make them yours: write what each one means in your own words, name the context clue or evidence that helped, then give one example from what you actually did in Environmental justice debate. Try your own words first; the glossary is there if you get stuck. This is voluntary and counts as extra credit, so keep it short.
Saved on this device. Show Mr. Mendoza or add these to your notebook glossary to claim the extra credit.
Classroom documents for this lesson are posted in Schoology. Open Clever, then Schoology, and find each one by the name shown on its card.
Open this when the class reaches this activity and use it to complete the required lesson artifact.
Placement rationale
Matched Environmental exposure and community health by path:Biomedical-Innovations/Problem-4_Environmental-Health/4.1_Environmental-Health; keywords:environmental, water quality. Score 142. Visibility: student-schoology (student-facing resource; link through Schoology rather than local path).
Use this if you were absent, got stuck, or need another pass before you submit the lesson artifact.
Placement rationale
Matched Environmental exposure and community health by path:Biomedical-Innovations/Problem-4_Environmental-Health/4.1_Environmental-Health; keywords:environmental, exposure. Score 138. Visibility: student-schoology (student-facing resource; link through Schoology rather than local path).
Open this when the class reaches this activity and use it to complete the required lesson artifact.
Placement rationale
Matched Environmental exposure and community health by path:Biomedical-Innovations/Problem-4_Environmental-Health/4.1_Environmental-Health; keywords:environmental. Score 134. Visibility: student-schoology (student-facing resource; link through Schoology rather than local path).
How to get there: open Clever and sign in with your Microsoft (district) account. Both myPLTW and Schoology are in Clever. Do the activity in myPLTW. Turn the work in on this site or hand it to Mr. Mendoza, because that is the step that counts as submitted. Schoology only shows your report-card grade later.
Check yourself · commit, then reveal▸
Claim ceiling for this check: The supplied lesson evidence can support an observation, pattern, classroom mechanism, or next-step decision about Environmental justice debate. It cannot by itself prove causation, establish a real clinical diagnosis, or justify action outside this classroom task.
A resident and a factory owner look at the same chart showing higher pollutant levels in the resident's neighborhood. Why might they draw opposite conclusions about who is responsible?
Write an answer and pick a confidence to unlock the key.
Fast retrieval with instant answers, not the commit-then-reveal check above. Try each from memory first: write what you remember about the earlier units, then check yourself here.
Go further and get help▸
What today's skills lead to. These are real health-science careers this course builds toward. Tap one to see, on the US Department of Labor's O*NET site, what the job actually involves, what it pays, and how fast it is growing.
Post a 150-word stance on who should pay to reduce unequal pollutant exposure, then reply to a classmate from a different stakeholder role.
Then submit your Exit ticket. Turn this in at the drop folder with your district Microsoft sign-in, or hand it to Mr. Mendoza in class. Both count as submitted. Doing the activity in myPLTW does not.
Class still runs. Complete the online activity above (it's self-guided). Need the concept taught without a teacher? Use this authoritative explainer:
EPA: Learn About Environmental HealthYou've passed Unit 2, so the optional extra-credit track is open. Complete reserved-unit work from home, including virtual labs, for extra credit. Each item shows its correct submission route.
Open the extra-credit track- CompleteEvery required part of the artifact is present, nothing left blank.
- AccurateThe science and the data are correct and match the evidence.
- Scientific reasoningYou explain your claim with evidence and reasoning (CER), not just an answer.
- Professional communicationClear, organized, labeled, and written the way a clinician or scientist would.
- SubmittedTurned in the right way, on the class site or handed to Mr. Mendoza in class, and confirmed. Not in Schoology: that is where the report-card grade appears later.