
PCR, restriction enzymes, electrophoresis, microarrays, and the limits of each method.
Your PLTW coursework: Medical Interventions ▸ Unit 2: How to Screen What is In Your Genes ▸ Lesson 2.1 Genetic Testing and Screening ▸ "Activity 2.1.2 Copying Our Genes"
What to do if absent- CER:
- Claim, Evidence, Reasoning: make a claim, back it with evidence, explain your reasoning.
- SOP:
- Standard Operating Procedure, the exact steps to follow (especially in a lab).
- Tracker:
- Your PLTW progress log where you record completed evidence.
- myPLTW:
- The PLTW course site where you do the online activities. Find it in Clever with your Microsoft sign-in, right next to Schoology.
Week overview - From Sample to Bands: Comparing Testing Methods
Compare PCR, , and microarrays, then read a gel to decide which sample carries a disease marker.
- 1Watch the Khan Academy PCR and gel clip in the PLTW course shell and jot the goal of each method in your own words.
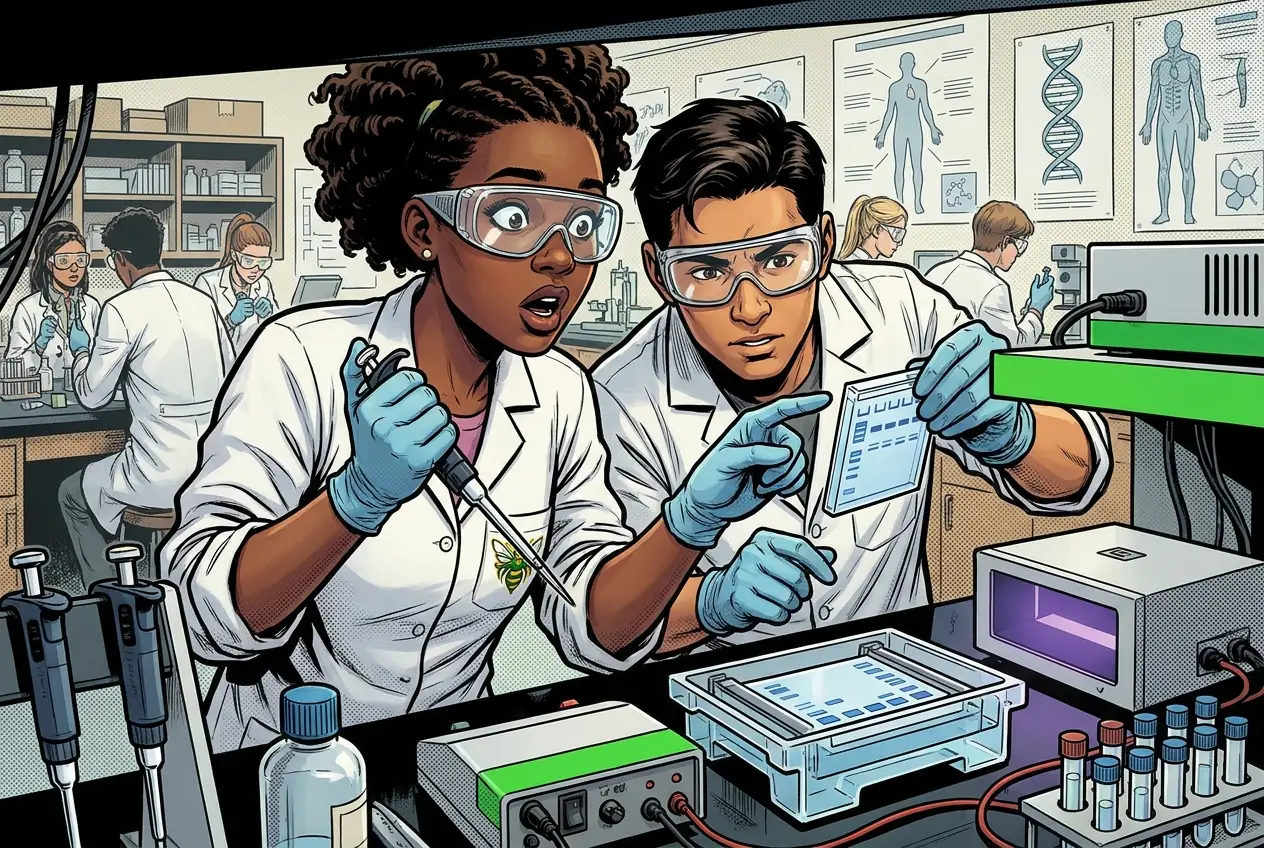
- 2Put on goggles and gloves, then load your provided dye samples into the gel wells using a micropipette.
- 3Run the gel at the set voltage and watch which direction the colored fronts move from the wells.
- 4While it runs, sketch a table comparing PCR, restriction enzymes, and microarrays with one strength and one limit each.
- 5After staining, measure how far each band traveled and rank the fragments from largest to smallest.
- 6Decide which lane matches the disease marker and write one sentence of evidence using the word banding.
- • You'll be able to load and run an gel safely.
- • You'll be able to explain why smaller DNA fragments travel farther on a gel.
- • You'll be able to choose the right method for a given testing question.
Daily lessons this week
Open any day for its full lesson, the work due that day, and guided notes.
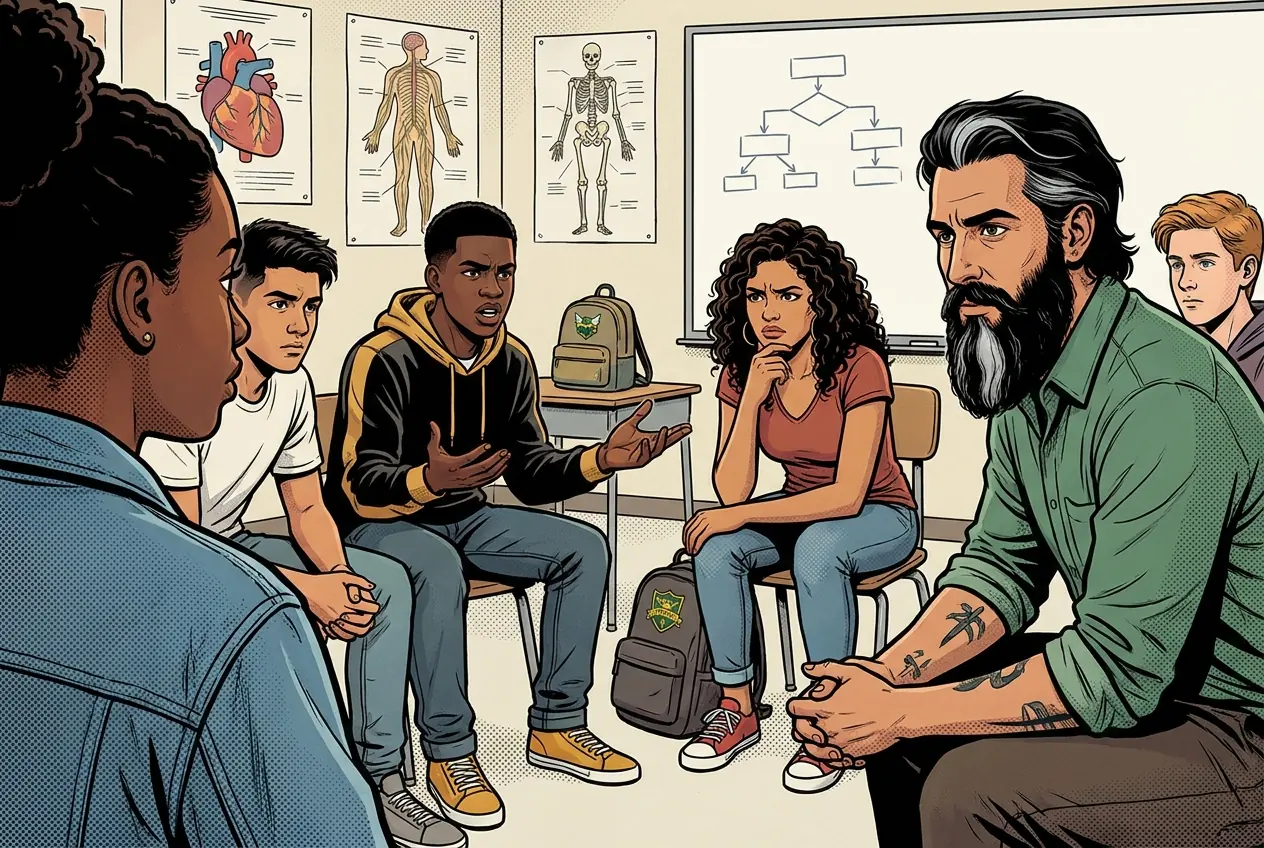
One CER on direct patient access to raw genetic results plus a reflection naming one counterargument.
Labeled PCR diagram showing all three steps with temperatures, binding sites, cut, and one bridging sentence to .
Gel banding with distances, largest-to-smallest ranking, two size estimates against the ladder, and an explanation of the size-migration relationship.
Three-row method comparison table (PCR, gel, ) plus one sentence on a microarray limit not shared by the other two methods.
Completed methods quiz plus a one-sentence correction for one missed or uncertain item.
Quick intro to the week
- Today matters because every clinic test you have heard of starts with copying or sorting DNA, and you will do both.
- Goal for today: run a real gel and read the banding pattern like a lab technician would.
- From Monday's debate, keep asking who gets access to test results once a method makes them easy to produce.
- Upload your gel sketch and method-comparison table to the class site, where the grade is recorded.
Your PLTW coursework this week
Do this: Advance the Unit 2 testing-methods benchmark by submitting your gel banding interpretation on the class site.
- • PCR uses primers to copy a target stretch of DNA many times.
- • sorts DNA by size, with smaller fragments traveling farther.
- • Microarrays use to detect many markers at once.
- • Read a gel banding pattern to compare fragment sizes.
- • Match a testing method to the question it best answers.
📋 Tracker evidence due this week: your gel banding interpretation and method-comparison table posted in the PLTW course shell.
All PLTW activities are completed inside the PLTW course environment: this page only gives direction.
This week's PLTW tracker
Your week at a glance. Check off each deliverable as you finish it, then submit so Mr. Mendoza can see how the class is pacing.
Use the code Mr. Mendoza gave you, not your name. Saved on this device.
| Day | Date | Focus | Key deliverable |
|---|---|---|---|
| Friday | Fri, Oct 16 | Access-to-results debate | One CER on direct patient access to raw genetic results plus a reflection naming one counterargument. |
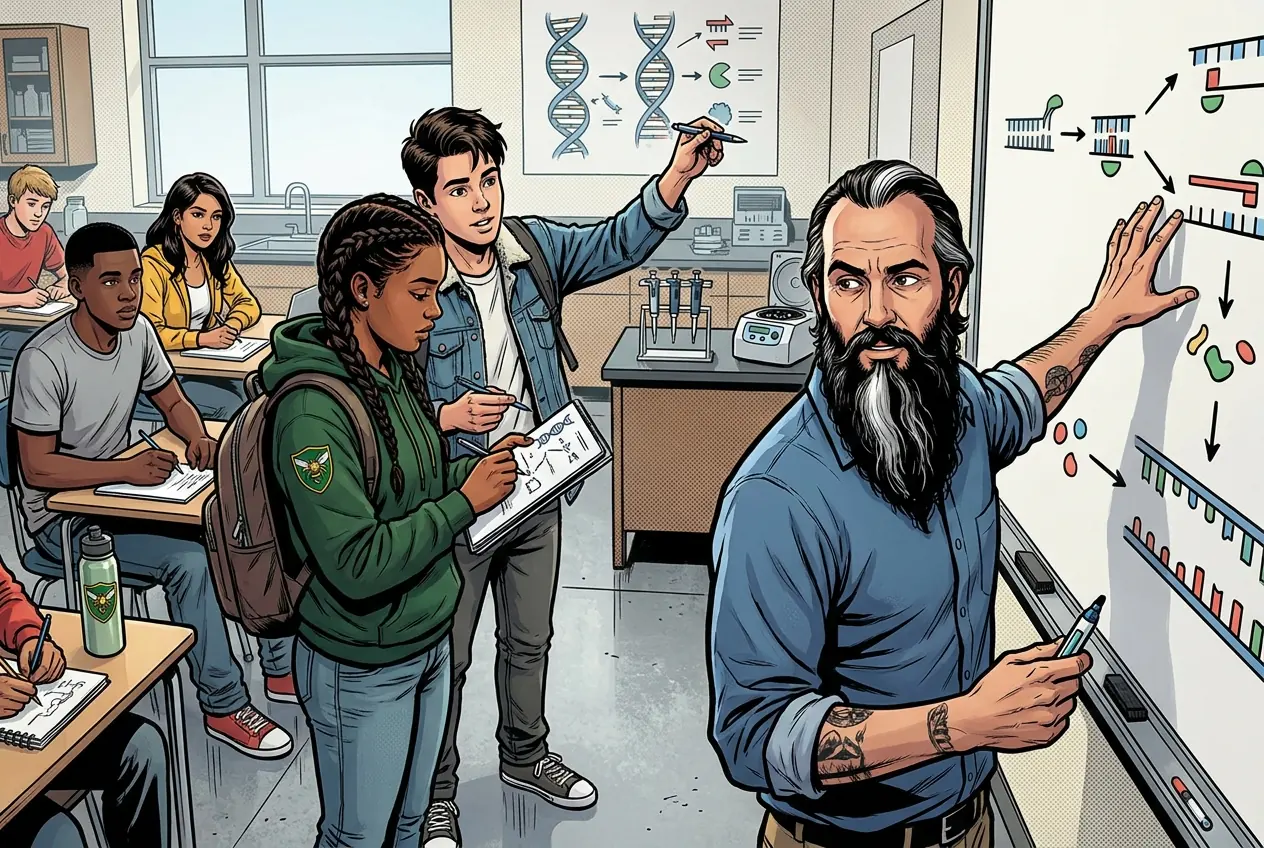
| Monday | Mon, Oct 19 | PCR and primers | Labeled PCR diagram showing all three steps with temperatures, primer binding sites, restriction enzyme cut, and one bridging sentence to gel electrophoresis. |
| Tuesday | Tue, Oct 20 | Gel electrophoresis lab | Gel banding data table with migration distances, largest-to-smallest ranking, two size estimates against the ladder, and an explanation of the size-migration relationship. |
| Thursday | - | Microarray introduction | Three-row method comparison table (PCR, gel, microarray) plus one sentence on a microarray limit not shared by the other two methods. |
| Friday | - | Methods quiz | Completed methods quiz plus a one-sentence correction for one missed or uncertain item. |
- M: access-to-results debate
- T: PCR diagram
- W: gel practice
- Th: microarray intro
- F: methods quiz
Due by week's end: Genetic testing methods quiz.
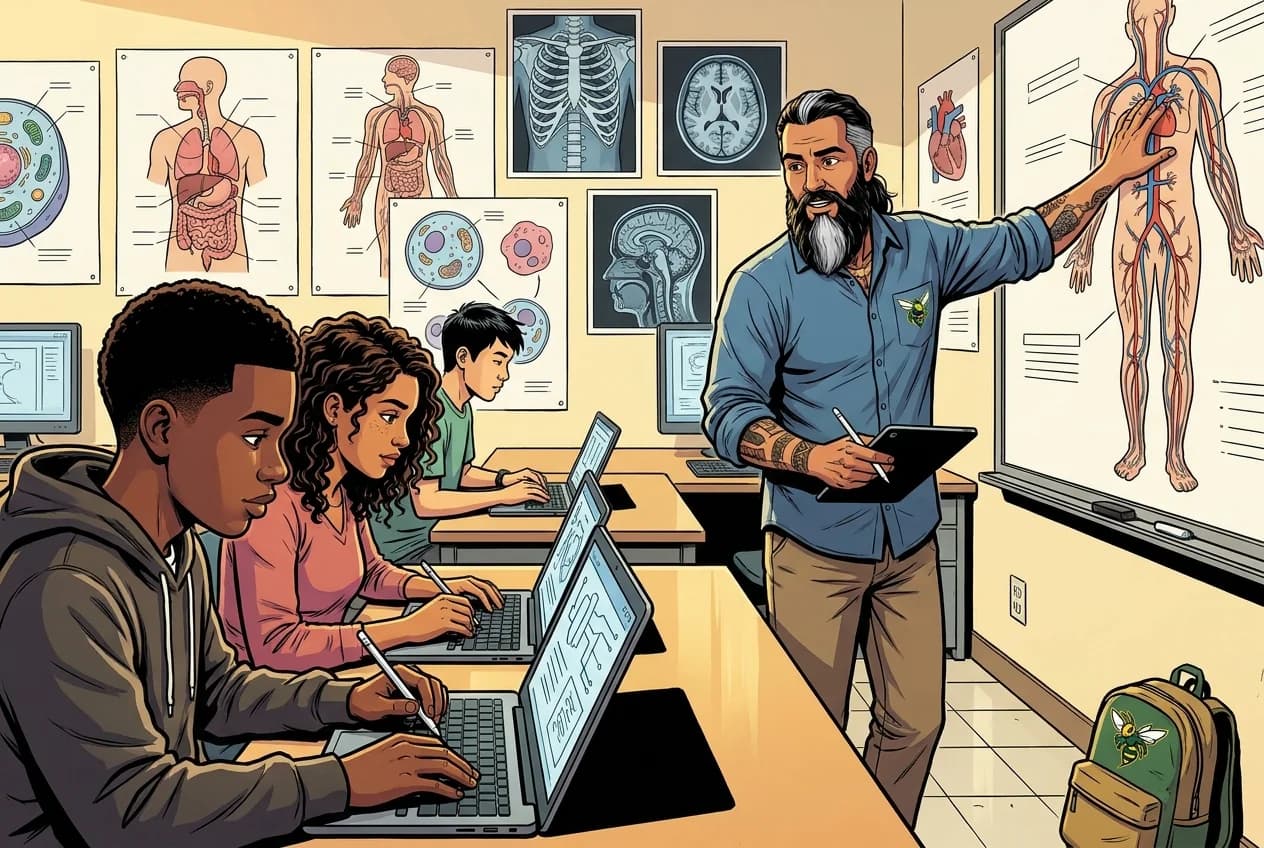
5 panels from the illustrated semester.

Fiction. There is no such student. The lessons, labs and dates are the real planned course; the student, the classmates and the conversations are invented.
Lab day: what to bring & watch
This explainer accompanies the PLTW lab protocol: watch it before lab.
What to do when absent
Most days, this class is your PLTW coursework: and PLTW is online and individual. So being out usually just means doing exactly what we did in class, from home.
Open Clever, then myPLTWHow to get there: open Clever and sign in with your Microsoft (district) account. Both myPLTW and Schoology are in Clever. Do the activity in myPLTW. Turn the work in on this site or hand it to Mr. Mendoza, because that is the step that counts as submitted. Schoology only shows your report-card grade later.
You can't do those from home: do this instead: Khan PCR / gel plus banding interpretation.
Class still runs. A substitute will post today's plan: complete the online activity above; it's built to be self-guided. Need the concept taught without a teacher? Use this authoritative explainer:
Genetic Science Learning Center: Gel ElectrophoresisVocabulary
Teacher-posted resources
Classroom documents for this lesson are posted in Schoology. Open Clever, then Schoology, and find each one by the name shown on its card.
Open this when the class reaches this activity and use it to complete the required lesson artifact.
Placement rationale
Matched PCR, , microarrays by path:Medical-Interventions/Unit-2_How-to-Screen-Your-Genes/2.1_Genetic-Testing-and-Screening; keywords:pcr, gel electrophoresis. Score 142. Visibility: student-schoology (student-facing resource; link through Schoology rather than local path).
Use this if you were absent, got stuck, or need another pass before you submit the lesson artifact.
Placement rationale
Matched PCR, , microarrays by path:Medical-Interventions/Unit-2_How-to-Screen-Your-Genes/00_Unit-Overview; keywords:pcr, gel electrophoresis. Score 138. Visibility: student-schoology (student-facing resource; link through Schoology rather than local path).
Use this after the required lesson work when you are ready for a harder application or a deeper connection.
Placement rationale
Matched PCR, , microarrays by path:Medical-Interventions/Unit-2_How-to-Screen-Your-Genes/2.1_Genetic-Testing-and-Screening; keywords:gel electrophoresis. Score 134. Visibility: student-schoology (student-facing resource; link through Schoology rather than local path).
How to get there: open Clever and sign in with your Microsoft (district) account. Both myPLTW and Schoology are in Clever. Do the activity in myPLTW. Turn the work in on this site or hand it to Mr. Mendoza, because that is the step that counts as submitted. Schoology only shows your report-card grade later.