

Bias, error, graph choice, CER conclusion, limitations.
Your PLTW coursework: Biomedical Innovation ▸ Problem 2: Exploring Human Physiology ▸ "Activity 2.1.3 Making Results Meaningful"
What to do if absent- CER:
- Claim, Evidence, Reasoning: make a claim, back it with evidence, explain your reasoning.
- SOP:
- Standard Operating Procedure, the exact steps to follow (especially in a lab).
- Tracker:
- Your PLTW progress log where you record completed evidence.
- myPLTW:
- The PLTW course site where you do the online activities. Find it in Clever with your Microsoft sign-in, right next to Schoology.
Week overview - Making the call: bias, error, graph choice, and a CER conclusion
Analyze your physiology dataset for bias and error, choose the right graph, and write a CER conclusion that names limitations and .
- 1Reopen your dataset and list one possible source of bias and one possible source of error.
- 2Choose the graph type that best fits your data and explain in one line why it fits.
- 3Build that graph in the spreadsheet with labeled axes and a clear title.
- 4Decide whether your two groups differ enough to call the result statistically significant.
- 5Write a CER conclusion: state a claim, give the data evidence, and explain the reasoning.
- 6Add one sentence naming a limitation of your study and how replication would help.
- • You will be able to identify bias and error in a dataset.
- • You will be able to choose and build an appropriate graph.
- • You will be able to write a CER conclusion that names limitations.
Daily lessons this week
Open any day for its full lesson, the work due that day, and guided notes.
CER contribution arguing for a specific biometric-privacy safeguard in physiological research, plus two questions and a reflection on applying it to your own analysis.
Draft graph showing the physiology comparison with labeled axes, units, a title, and an annotated bias-and-error note.
Spreadsheet statistical analysis: summary statistics per condition, t-test result with interpretation, and reproducible step documentation.
Problem 2 CER analysis mini-report: specific claim, statistical evidence with values, reasoning, and at least two honest limitations.
Quick intro to the week
- Hook: the same data can tell two different stories, so the honest analyst names the bias and the limits.
- Today's goal: turn your physiology numbers into a defensible, evidence-based conclusion.
- Monday's bioethics debate on biometric privacy connects: who should ever see your heart-rate data?
- Reminder: your graded analysis and CER conclusion live in the PLTW course shell.
Your PLTW coursework this week
Do this: Advance PLTW Problem 2 by completing your statistical analysis and CER conclusion in myPLTW.
- • Bias systematically pushes results in one direction; error is random scatter.
- • means a result is unlikely to be due to chance alone.
- • Choose a graph type that matches the data.
- • Write a CER conclusion that names study limitations.
📋 PLTW evidence due: completed spreadsheet analysis, labeled graph, and CER conclusion in the course shell.
All PLTW activities are completed inside the PLTW course environment: this page only gives direction.
This week's PLTW tracker
Your week at a glance. Check off each deliverable as you finish it, then submit so Mr. Mendoza can see how the class is pacing.
Use the code Mr. Mendoza gave you, not your name. Saved on this device.
| Day | Date | Focus | Key deliverable |
|---|---|---|---|
| Wednesday | Wed, Mar 10 | Biometric-privacy debate | CER contribution arguing for a specific biometric-privacy safeguard in physiological research, plus two questions and a reflection on applying it to your own analysis. |
| Thursday | Thu, Mar 11 | Bias, error, graph choice | Draft graph showing the physiology comparison with labeled axes, units, a title, and an annotated bias-and-error note. |
| Friday | Fri, Mar 12 | Statistics lab analysis | Spreadsheet statistical analysis: summary statistics per condition, t-test result with interpretation, and reproducible step documentation. |
| Tuesday | Tue, Mar 16 | CER mini-report | Problem 2 CER analysis mini-report: specific claim, statistical evidence with values, reasoning, and at least two honest limitations. |
- M: biometric privacy debate
- T: graph draft
- W: analysis
- Th: mini-report
- F: no school
Due by week's end: Problem 2 analysis mini-report.
4 panels from the illustrated semester.
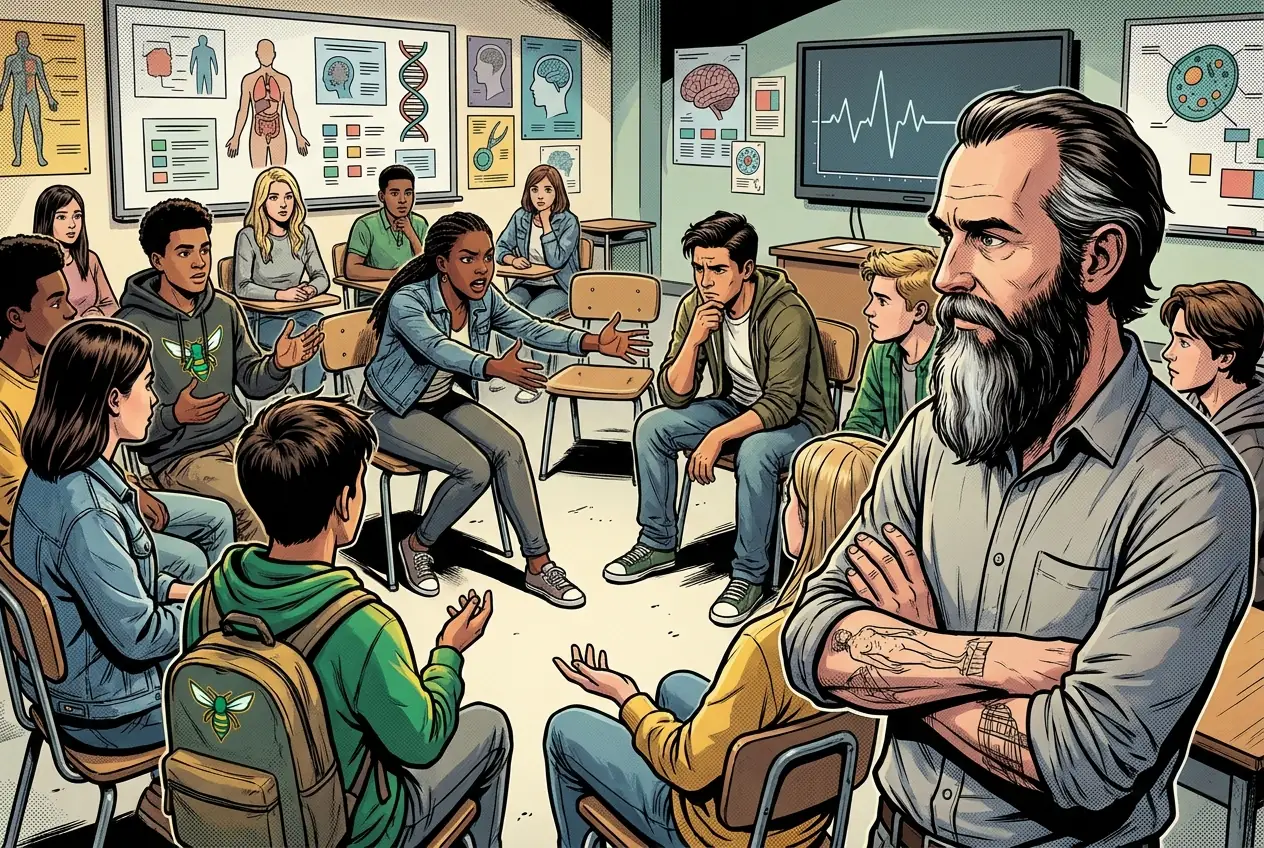
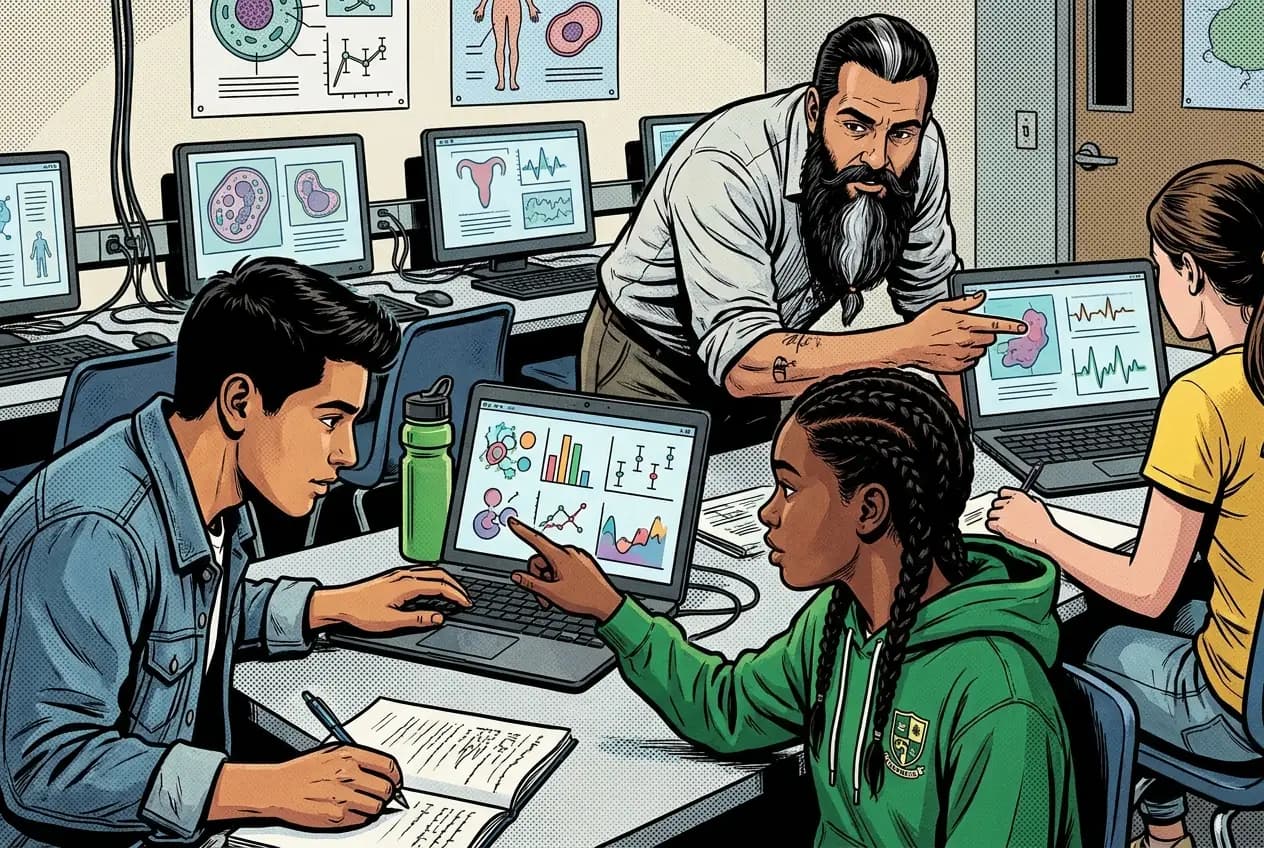
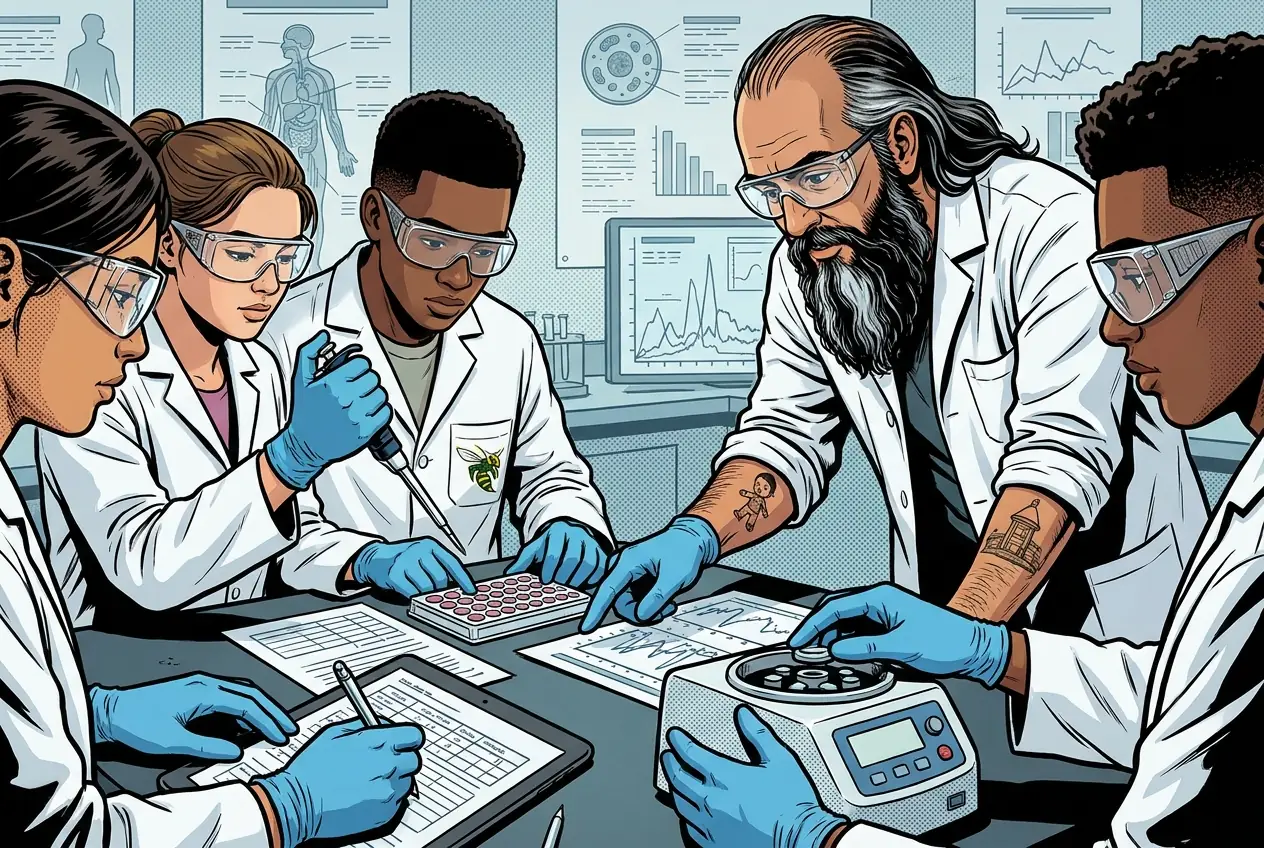

Fiction. There is no such student. The lessons, labs and dates are the real planned course; the student, the classmates and the conversations are invented.
Lab day: what to bring & watch
This explainer accompanies the PLTW lab protocol: watch it before lab.
What to do when absent
Most days, this class is your PLTW coursework: and PLTW is online and individual. So being out usually just means doing exactly what we did in class, from home.
Open Clever, then myPLTWHow to get there: open Clever and sign in with your Microsoft (district) account. Both myPLTW and Schoology are in Clever. Do the activity in myPLTW. Turn the work in on this site or hand it to Mr. Mendoza, because that is the step that counts as submitted. Schoology only shows your report-card grade later.
You can't do those from home: do this instead: Spreadsheet analysis.
Class still runs. A substitute will post today's plan: complete the online activity above; it's built to be self-guided. Need the concept taught without a teacher? Use this authoritative explainer:
Khan Academy Statistics and ProbabilityVocabulary
Virtual resources
Teacher-posted resources
Classroom documents for this lesson are posted in Schoology. Open Clever, then Schoology, and find each one by the name shown on its card.
Use this if you were absent, got stuck, or need another pass before you submit the lesson artifact.
Placement rationale
Matched Statistical analysis and t-test reasoning by path:Biomedical-Innovations/Problem-2_Human-Physiology/2.1_Human-Physiology; keywords:statistical analysis. Score 138. Visibility: student-schoology (student-facing resource; link through Schoology rather than local path).
Use this if you were absent, got stuck, or need another pass before you submit the lesson artifact.
Placement rationale
Matched Statistical analysis and t-test reasoning by path:Biomedical-Innovations/Problem-2_Human-Physiology/2.1_Human-Physiology; keywords:statistical analysis. Score 134. Visibility: student-schoology (student-facing resource; link through Schoology rather than local path).
Open this when the class reaches this activity and use it to complete the required lesson artifact.
Placement rationale
Matched Statistical analysis and t-test reasoning by path:Biomedical-Innovations/Problem-2_Human-Physiology/2.1_Human-Physiology. Score 126. Visibility: student-schoology (student-facing resource; link through Schoology rather than local path).
How to get there: open Clever and sign in with your Microsoft (district) account. Both myPLTW and Schoology are in Clever. Do the activity in myPLTW. Turn the work in on this site or hand it to Mr. Mendoza, because that is the step that counts as submitted. Schoology only shows your report-card grade later.