John Hay Biomedical · Week 5 · September 21 to 25, 2026
Week 5 figure sheet: PBS
The profile, the clock, and the two errors. Periods 1-2 and 6A-7B.
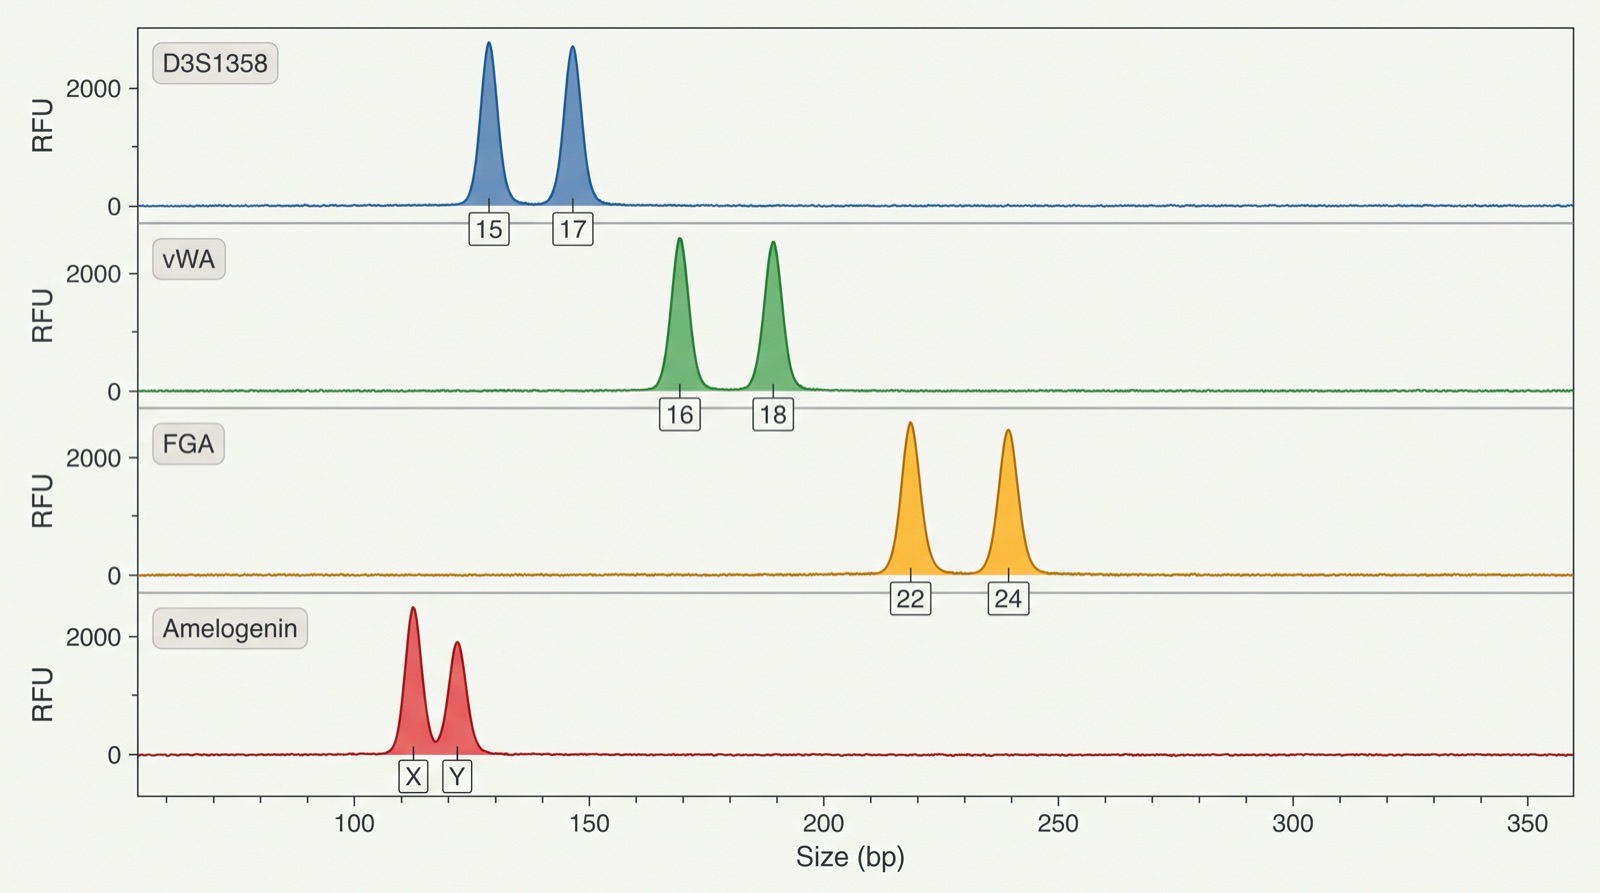
Figure 1. A DNA profile drawn as peaks
How to read it
This is the same kind of DNA profile as a gel, drawn a second way, as peaks on a machine readout instead of bands. Each row is one STR locus, and the number printed under each peak is a repeat count. Amelogenin is not an identity locus: X and Y is the male pattern, and a single X is the female pattern. Part A does not use this figure. Part A uses the gel bands in the Case record on today's class page: compare your questioned lane with each reference lane, band by band.
What this figure does not supply
This figure does not supply a rarity figure, so it cannot tell you how strong a match is. The spacing between paired peaks is stretched for legibility, so read the allele NUMBERS, never the base-pair positions.
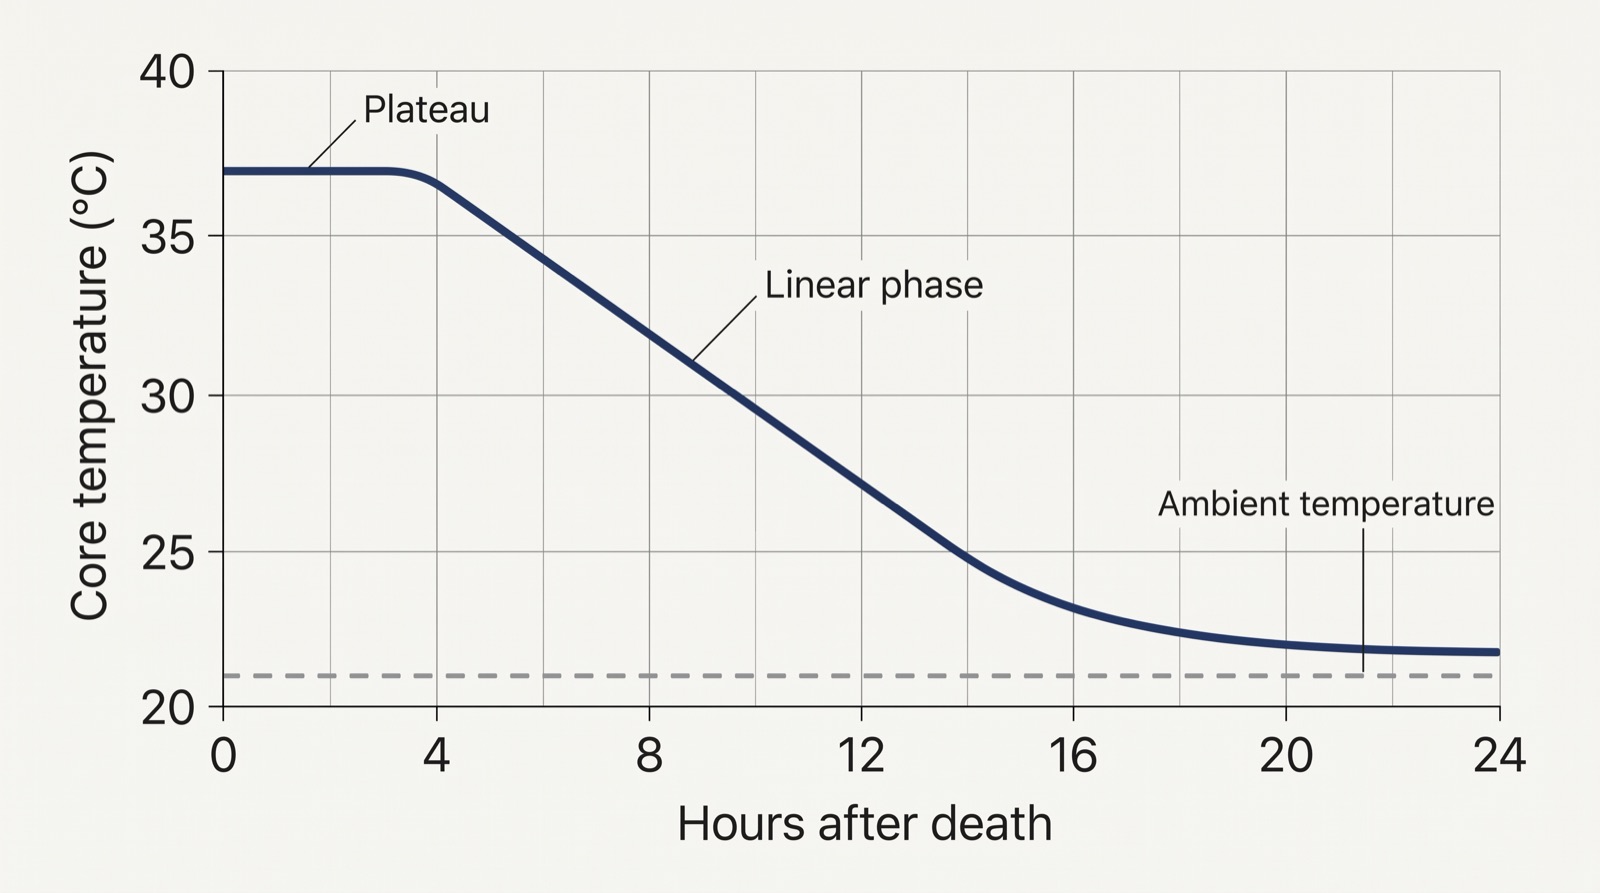
Figure 2. Body cooling after death
How to read it
Read the shape, not a single number. The temperature holds nearly flat at first, then falls steadily, then flattens again as it approaches the room. Find where the flat part ends and the steady fall begins.
What this figure does not supply
This figure does not supply a time of death. It shows one cooling curve under one set of conditions. Body size, clothing, covering, moving air and a wet or cold surface all change the rate, which is why an examiner uses adjusted tables rather than a single curve.
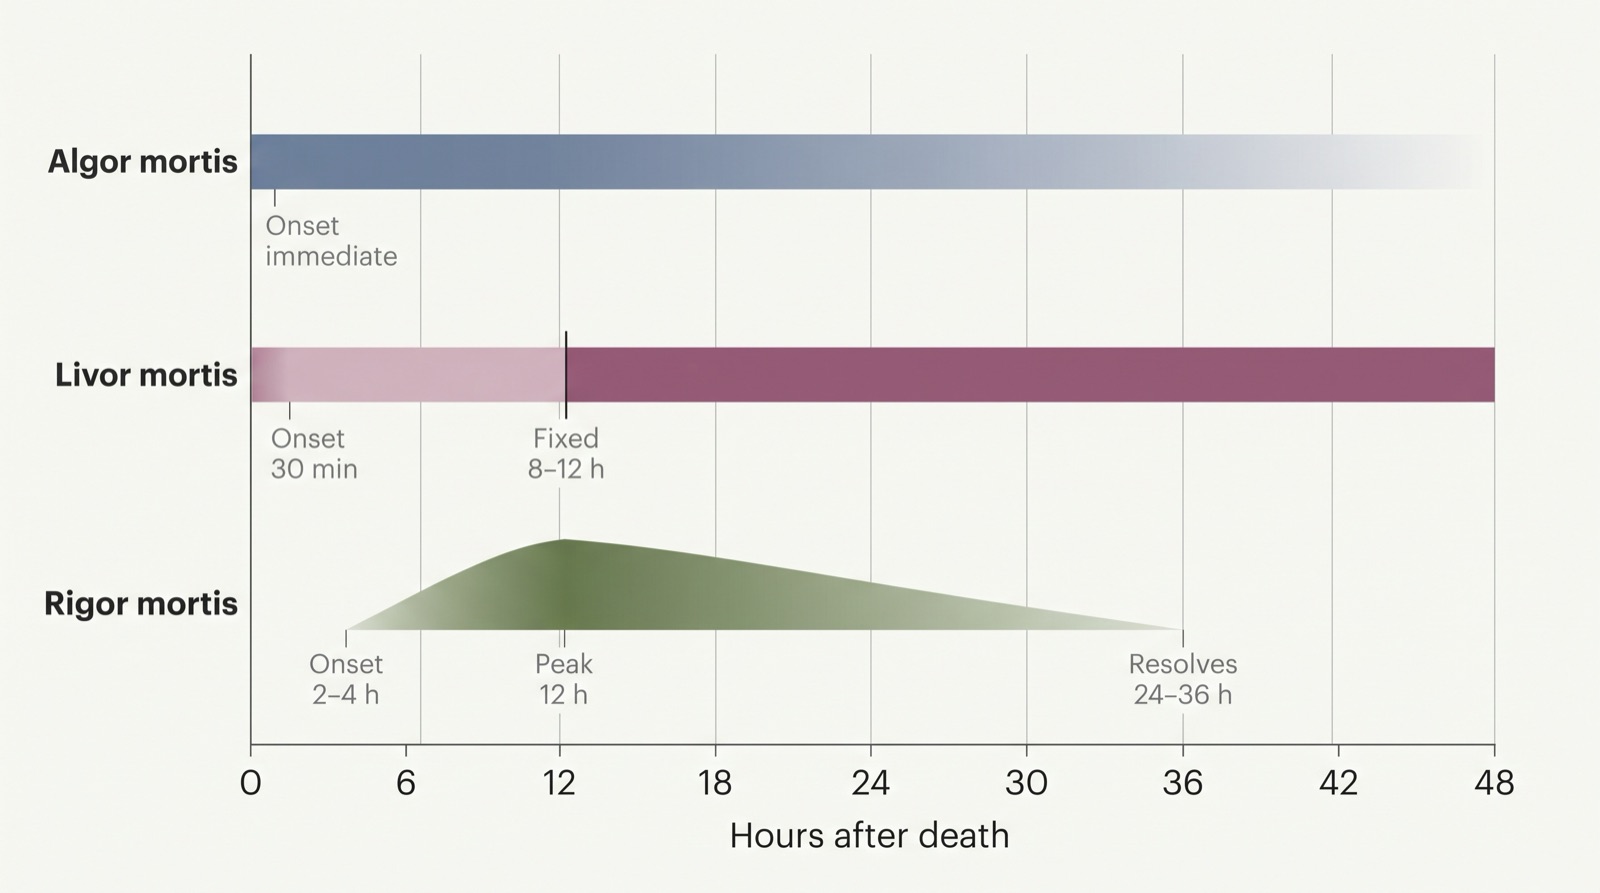
Figure 3. Three clocks, three schedules
How to read it
Each band is one postmortem change and the hours it covers. Read across to see which changes overlap at a given hour. Where all three bands agree is where your window sits.
What this figure does not supply
These are approximate ranges under average conditions, not fixed rules. Heat, cold and heavy activity before death all shift them. This figure does not supply your case's observations; those come from your own record.
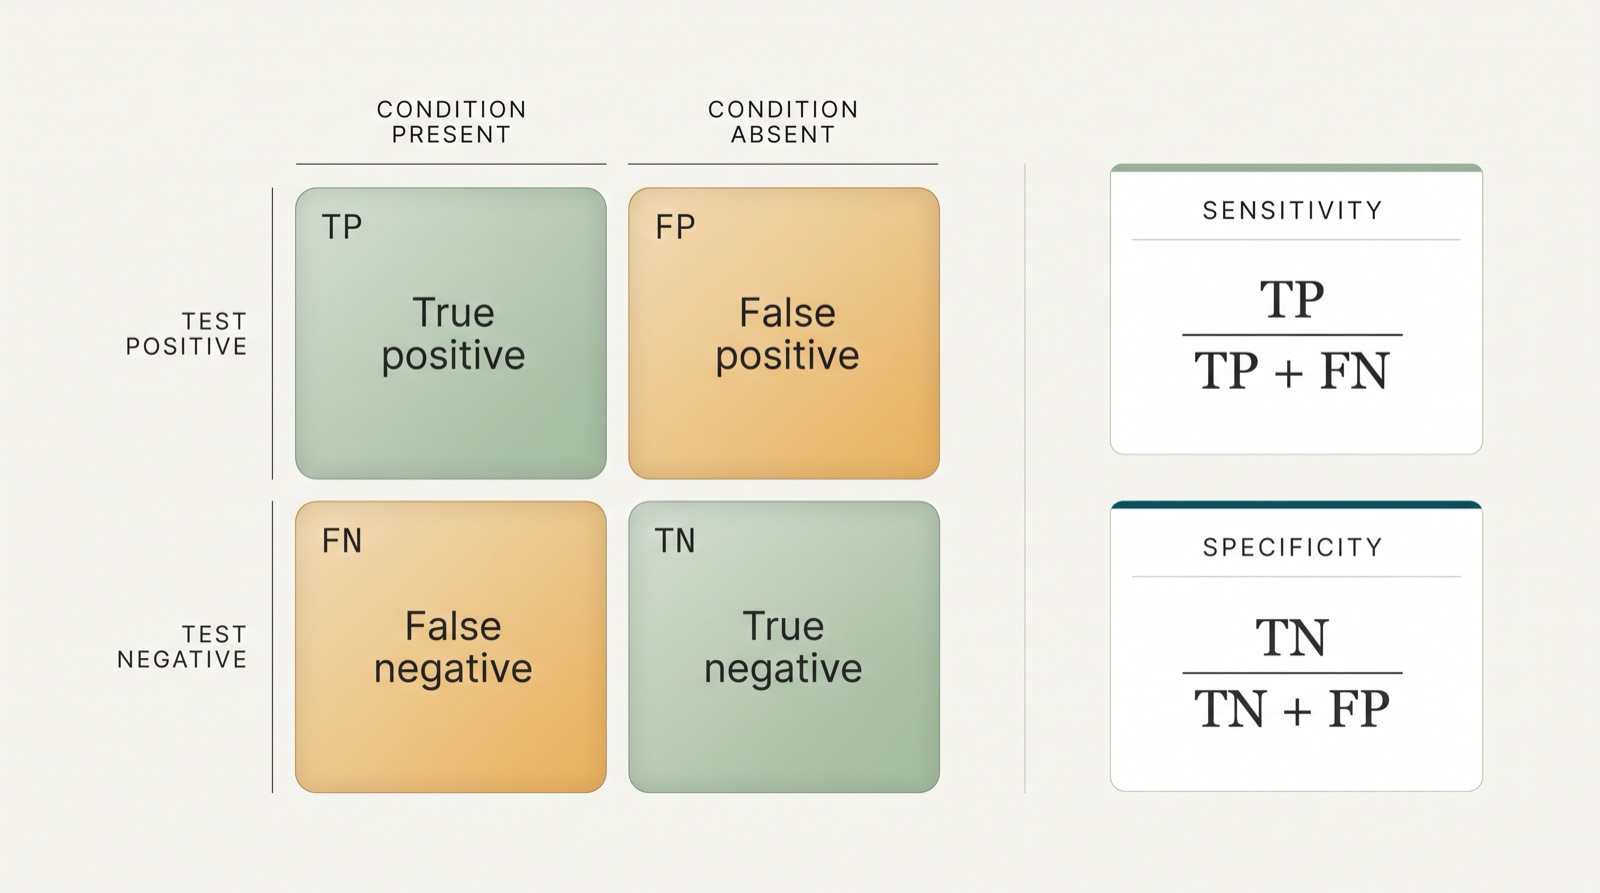
Figure 4. The four outcomes of any test
How to read it
Columns are what is actually true. Rows are what the test said. Read the cell where the two meet. The two formulas underneath show which cells each rate is built from.
What this figure does not supply
This figure does not supply any error rate for the Novel Flu Syndrome test in the debate case. None was given, so none may be invented or calculated.
Using these figures
Every figure here is a teaching illustration drawn for this course. Each one is accurate in the relationship it shows, and each caption names what it cannot tell you.
The rule that applies to all four
A figure narrows what is possible. It does not close a question. When you write a claim from any figure on this sheet, write the limit underneath it in the same breath: this shows ___, it does not show ___.
Generated 2026-09-21 for John Hay High School, Cleveland Metropolitan School District. Figures are original illustrations produced for this class and checked against the science they name before publication.